Version 3.1.3
Note
Click here to download the full example code
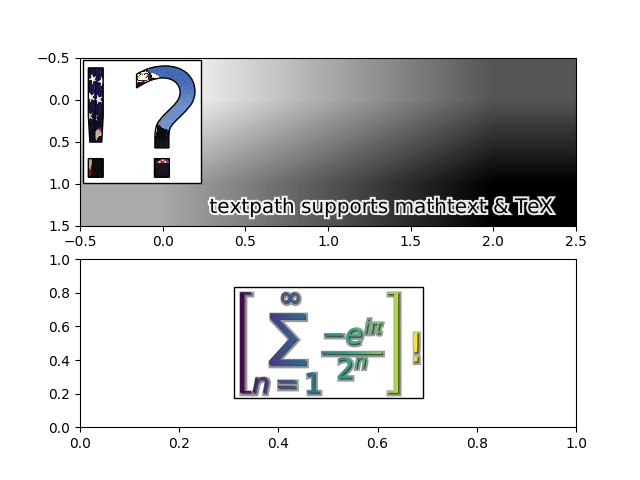
Use a text as Path. The tool that allows for such conversion is a
TextPath. The resulting path can be employed
e.g. as a clip path for an image.

import matplotlib.pyplot as plt
from matplotlib.image import BboxImage
import numpy as np
from matplotlib.transforms import IdentityTransform

import matplotlib.patches as mpatches

from matplotlib.offsetbox import AnnotationBbox,\
    AnchoredOffsetbox, AuxTransformBox

from matplotlib.cbook import get_sample_data

from matplotlib.text import TextPath


class PathClippedImagePatch(mpatches.PathPatch):
    """
    The given image is used to draw the face of the patch. Internally,
    it uses BboxImage whose clippath set to the path of the patch.

    FIXME : The result is currently dpi dependent.
    """

    def __init__(self, path, bbox_image, **kwargs):
        mpatches.PathPatch.__init__(self, path, **kwargs)
        self._init_bbox_image(bbox_image)

    def set_facecolor(self, color):
        """simply ignore facecolor"""
        mpatches.PathPatch.set_facecolor(self, "none")

    def _init_bbox_image(self, im):

        bbox_image = BboxImage(self.get_window_extent,
                               norm=None,
                               origin=None,
                               )
        bbox_image.set_transform(IdentityTransform())

        bbox_image.set_data(im)
        self.bbox_image = bbox_image

    def draw(self, renderer=None):

        # the clip path must be updated every draw. any solution? -JJ
        self.bbox_image.set_clip_path(self._path, self.get_transform())
        self.bbox_image.draw(renderer)

        mpatches.PathPatch.draw(self, renderer)


if __name__ == "__main__":

    usetex = plt.rcParams["text.usetex"]

    fig = plt.figure()

    # EXAMPLE 1

    ax = plt.subplot(211)

    arr = plt.imread(get_sample_data("grace_hopper.png"))

    text_path = TextPath((0, 0), "!?", size=150)
    p = PathClippedImagePatch(text_path, arr, ec="k",
                              transform=IdentityTransform())

    # p.set_clip_on(False)

    # make offset box
    offsetbox = AuxTransformBox(IdentityTransform())
    offsetbox.add_artist(p)

    # make anchored offset box
    ao = AnchoredOffsetbox(loc='upper left', child=offsetbox, frameon=True,
                           borderpad=0.2)
    ax.add_artist(ao)

    # another text
    from matplotlib.patches import PathPatch
    if usetex:
        r = r"\mbox{textpath supports mathtext \& \TeX}"
    else:
        r = r"textpath supports mathtext & TeX"

    text_path = TextPath((0, 0), r,
                         size=20, usetex=usetex)

    p1 = PathPatch(text_path, ec="w", lw=3, fc="w", alpha=0.9,
                   transform=IdentityTransform())
    p2 = PathPatch(text_path, ec="none", fc="k",
                   transform=IdentityTransform())

    offsetbox2 = AuxTransformBox(IdentityTransform())
    offsetbox2.add_artist(p1)
    offsetbox2.add_artist(p2)

    ab = AnnotationBbox(offsetbox2, (0.95, 0.05),
                        xycoords='axes fraction',
                        boxcoords="offset points",
                        box_alignment=(1., 0.),
                        frameon=False
                        )
    ax.add_artist(ab)

    ax.imshow([[0, 1, 2], [1, 2, 3]], cmap=plt.cm.gist_gray_r,
              interpolation="bilinear",
              aspect="auto")

    # EXAMPLE 2

    ax = plt.subplot(212)

    arr = np.arange(256).reshape(1, 256)/256.

    if usetex:
        s = (r"$\displaystyle\left[\sum_{n=1}^\infty"
             r"\frac{-e^{i\pi}}{2^n}\right]$!")
    else:
        s = r"$\left[\sum_{n=1}^\infty\frac{-e^{i\pi}}{2^n}\right]$!"
    text_path = TextPath((0, 0), s, size=40, usetex=usetex)
    text_patch = PathClippedImagePatch(text_path, arr, ec="none",
                                       transform=IdentityTransform())

    shadow1 = mpatches.Shadow(text_patch, 1, -1,
                              props=dict(fc="none", ec="0.6", lw=3))
    shadow2 = mpatches.Shadow(text_patch, 1, -1,
                              props=dict(fc="0.3", ec="none"))

    # make offset box
    offsetbox = AuxTransformBox(IdentityTransform())
    offsetbox.add_artist(shadow1)
    offsetbox.add_artist(shadow2)
    offsetbox.add_artist(text_patch)

    # place the anchored offset box using AnnotationBbox
    ab = AnnotationBbox(offsetbox, (0.5, 0.5),
                        xycoords='data',
                        boxcoords="offset points",
                        box_alignment=(0.5, 0.5),
                        )
    # text_path.set_size(10)

    ax.add_artist(ab)

    ax.set_xlim(0, 1)
    ax.set_ylim(0, 1)

    plt.show()
Keywords: matplotlib code example, codex, python plot, pyplot Gallery generated by Sphinx-Gallery