Version 3.1.3
Note
Click here to download the full example code
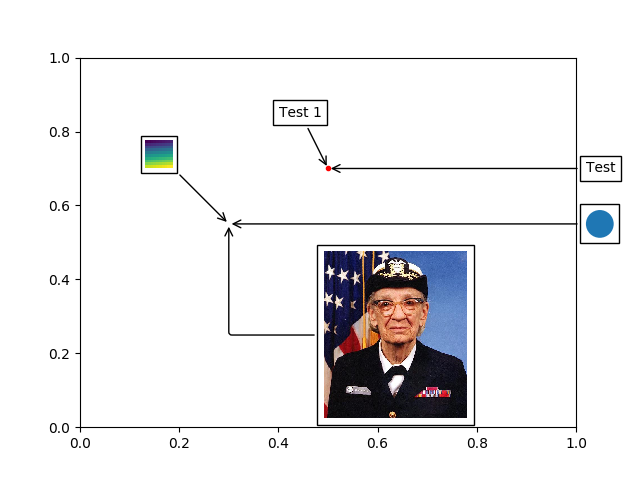
The AnnotationBbox Artist creates an annotation using an OffsetBox. This example demonstrates three different OffsetBoxes: TextArea, DrawingArea and OffsetImage. AnnotationBbox gives more fine-grained control than using the axes method annotate.
import matplotlib.pyplot as plt
import numpy as np

from matplotlib.patches import Circle
from matplotlib.offsetbox import (TextArea, DrawingArea, OffsetImage,
                                  AnnotationBbox)
from matplotlib.cbook import get_sample_data


fig, ax = plt.subplots()

# Define a 1st position to annotate (display it with a marker)
xy = (0.5, 0.7)
ax.plot(xy[0], xy[1], ".r")

# Annotate the 1st position with a text box ('Test 1')
offsetbox = TextArea("Test 1", minimumdescent=False)

ab = AnnotationBbox(offsetbox, xy,
                    xybox=(-20, 40),
                    xycoords='data',
                    boxcoords="offset points",
                    arrowprops=dict(arrowstyle="->"))
ax.add_artist(ab)

# Annotate the 1st position with another text box ('Test')
offsetbox = TextArea("Test", minimumdescent=False)

ab = AnnotationBbox(offsetbox, xy,
                    xybox=(1.02, xy[1]),
                    xycoords='data',
                    boxcoords=("axes fraction", "data"),
                    box_alignment=(0., 0.5),
                    arrowprops=dict(arrowstyle="->"))
ax.add_artist(ab)

# Define a 2nd position to annotate (don't display with a marker this time)
xy = [0.3, 0.55]

# Annotate the 2nd position with a circle patch
da = DrawingArea(20, 20, 0, 0)
p = Circle((10, 10), 10)
da.add_artist(p)

ab = AnnotationBbox(da, xy,
                    xybox=(1.02, xy[1]),
                    xycoords='data',
                    boxcoords=("axes fraction", "data"),
                    box_alignment=(0., 0.5),
                    arrowprops=dict(arrowstyle="->"))

ax.add_artist(ab)

# Annotate the 2nd position with an image (a generated array of pixels)
arr = np.arange(100).reshape((10, 10))
im = OffsetImage(arr, zoom=2)
im.image.axes = ax

ab = AnnotationBbox(im, xy,
                    xybox=(-50., 50.),
                    xycoords='data',
                    boxcoords="offset points",
                    pad=0.3,
                    arrowprops=dict(arrowstyle="->"))

ax.add_artist(ab)

# Annotate the 2nd position with another image (a Grace Hopper portrait)
with get_sample_data("grace_hopper.png") as file:
    arr_img = plt.imread(file, format='png')

imagebox = OffsetImage(arr_img, zoom=0.2)
imagebox.image.axes = ax

ab = AnnotationBbox(imagebox, xy,
                    xybox=(120., -80.),
                    xycoords='data',
                    boxcoords="offset points",
                    pad=0.5,
                    arrowprops=dict(
                        arrowstyle="->",
                        connectionstyle="angle,angleA=0,angleB=90,rad=3")
                    )

ax.add_artist(ab)

# Fix the display limits to see everything
ax.set_xlim(0, 1)
ax.set_ylim(0, 1)

plt.show()
The use of the following functions, methods and classes is shown in this example:
Out:
<function show at 0x7f18a5a5a700>
Keywords: matplotlib code example, codex, python plot, pyplot Gallery generated by Sphinx-Gallery