Version 3.1.3
Note
Click here to download the full example code
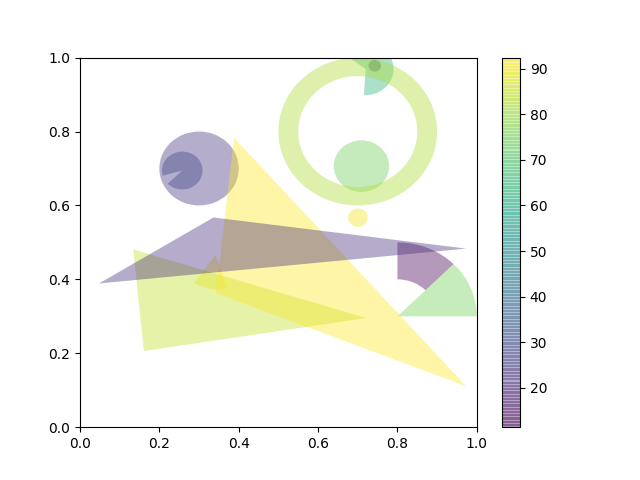
This example demonstrates how to use
patch collections.
import numpy as np
from matplotlib.patches import Circle, Wedge, Polygon
from matplotlib.collections import PatchCollection
import matplotlib.pyplot as plt

# Fixing random state for reproducibility
np.random.seed(19680801)


fig, ax = plt.subplots()

resolution = 50  # the number of vertices
N = 3
x = np.random.rand(N)
y = np.random.rand(N)
radii = 0.1*np.random.rand(N)
patches = []
for x1, y1, r in zip(x, y, radii):
    circle = Circle((x1, y1), r)
    patches.append(circle)

x = np.random.rand(N)
y = np.random.rand(N)
radii = 0.1*np.random.rand(N)
theta1 = 360.0*np.random.rand(N)
theta2 = 360.0*np.random.rand(N)
for x1, y1, r, t1, t2 in zip(x, y, radii, theta1, theta2):
    wedge = Wedge((x1, y1), r, t1, t2)
    patches.append(wedge)

# Some limiting conditions on Wedge
patches += [
    Wedge((.3, .7), .1, 0, 360),             # Full circle
    Wedge((.7, .8), .2, 0, 360, width=0.05),  # Full ring
    Wedge((.8, .3), .2, 0, 45),              # Full sector
    Wedge((.8, .3), .2, 45, 90, width=0.10),  # Ring sector
]

for i in range(N):
    polygon = Polygon(np.random.rand(N, 2), True)
    patches.append(polygon)

colors = 100*np.random.rand(len(patches))
p = PatchCollection(patches, alpha=0.4)
p.set_array(np.array(colors))
ax.add_collection(p)
fig.colorbar(p, ax=ax)

plt.show()
The use of the following functions, methods, classes and modules is shown in this example:
import matplotlib
matplotlib.patches
matplotlib.patches.Circle
matplotlib.patches.Wedge
matplotlib.patches.Polygon
matplotlib.collections.PatchCollection
matplotlib.collections.Collection.set_array
matplotlib.axes.Axes.add_collection
matplotlib.figure.Figure.colorbar
Out:
<function Figure.colorbar at 0x7f18a5a59dc0>
Keywords: matplotlib code example, codex, python plot, pyplot Gallery generated by Sphinx-Gallery