You are reading an old version of the documentation (v3.1.3). For the latest version see https://matplotlib.org/stable/
Version 3.1.3
matplotlib
Fork me on GitHub

Table of Contents

Related Topics

Whats New 0.98.4 Legend

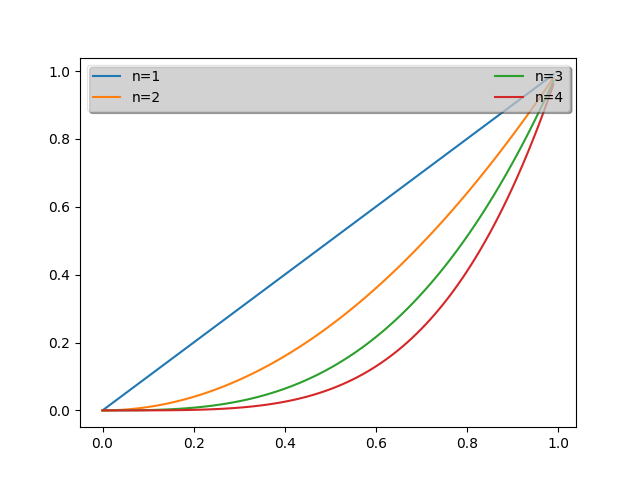
Create a legend and tweak it with a shadow and a box.

import matplotlib.pyplot as plt
import numpy as np


ax = plt.subplot(111)
t1 = np.arange(0.0, 1.0, 0.01)
for n in [1, 2, 3, 4]:
    plt.plot(t1, t1**n, label="n=%d"%(n,))

leg = plt.legend(loc='best', ncol=2, mode="expand", shadow=True, fancybox=True)
leg.get_frame().set_alpha(0.5)


plt.show()
../../_images/sphx_glr_whats_new_98_4_legend_001.png

References

The use of the following functions, methods, classes and modules is shown in this example:

import matplotlib
matplotlib.axes.Axes.legend
matplotlib.pyplot.legend
matplotlib.legend.Legend
matplotlib.legend.Legend.get_frame

Out:

<function Legend.get_frame at 0x7f18a5ba1280>

Keywords: matplotlib code example, codex, python plot, pyplot Gallery generated by Sphinx-Gallery