Version 3.1.3
Note
Click here to download the full example code
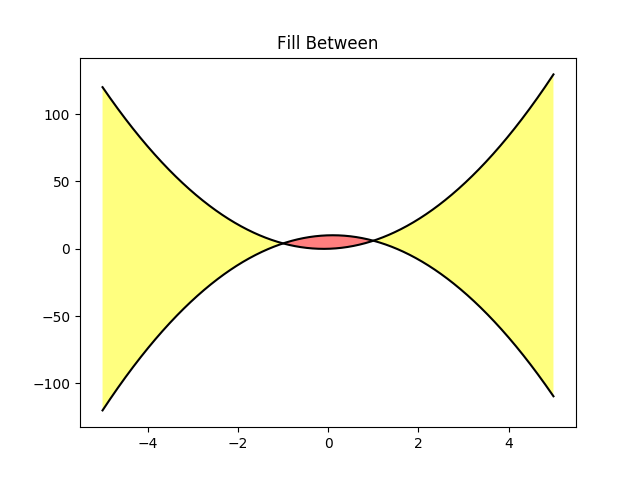
Fill the area between two curves.
import matplotlib.pyplot as plt
import numpy as np

x = np.arange(-5, 5, 0.01)
y1 = -5*x*x + x + 10
y2 = 5*x*x + x

fig, ax = plt.subplots()
ax.plot(x, y1, x, y2, color='black')
ax.fill_between(x, y1, y2, where=y2 >y1, facecolor='yellow', alpha=0.5)
ax.fill_between(x, y1, y2, where=y2 <=y1, facecolor='red', alpha=0.5)
ax.set_title('Fill Between')

plt.show()
The use of the following functions, methods, classes and modules is shown in this example:
import matplotlib
matplotlib.axes.Axes.fill_between
Out:
<function Axes.fill_between at 0x7f18a5a90ee0>
Keywords: matplotlib code example, codex, python plot, pyplot Gallery generated by Sphinx-Gallery