Version 3.1.3
Note
Click here to download the full example code
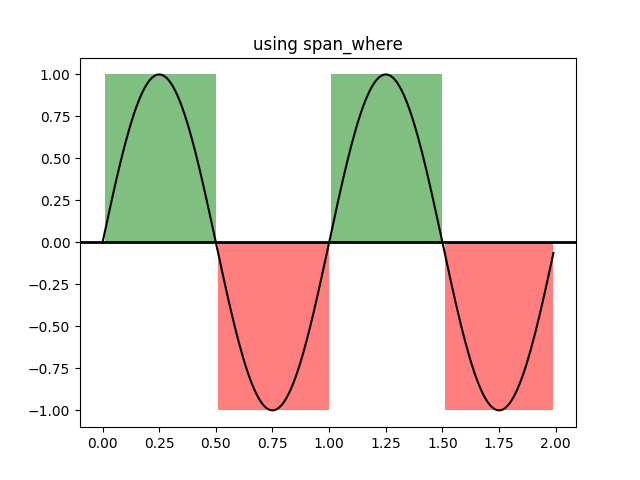
Illustrate some helper functions for shading regions where a logical mask is True.
See matplotlib.collections.BrokenBarHCollection.span_where()
import numpy as np
import matplotlib.pyplot as plt
import matplotlib.collections as collections


t = np.arange(0.0, 2, 0.01)
s1 = np.sin(2*np.pi*t)
s2 = 1.2*np.sin(4*np.pi*t)


fig, ax = plt.subplots()
ax.set_title('using span_where')
ax.plot(t, s1, color='black')
ax.axhline(0, color='black', lw=2)

collection = collections.BrokenBarHCollection.span_where(
    t, ymin=0, ymax=1, where=s1 > 0, facecolor='green', alpha=0.5)
ax.add_collection(collection)

collection = collections.BrokenBarHCollection.span_where(
    t, ymin=-1, ymax=0, where=s1 < 0, facecolor='red', alpha=0.5)
ax.add_collection(collection)


plt.show()
The use of the following functions, methods, classes and modules is shown in this example:
import matplotlib
matplotlib.collections.BrokenBarHCollection
matplotlib.collections.BrokenBarHCollection.span_where
matplotlib.axes.Axes.add_collection
matplotlib.axes.Axes.axhline
Out:
<function Axes.axhline at 0x7f18a5a87040>
Keywords: matplotlib code example, codex, python plot, pyplot Gallery generated by Sphinx-Gallery