You are reading an old version of the documentation (v3.1.3). For the latest version see https://matplotlib.org/stable/gallery/images_contours_and_fields/quiver_simple_demo.html
Version 3.1.3
matplotlib
Fork me on GitHub

Table of Contents

Related Topics

Quiver Simple Demo

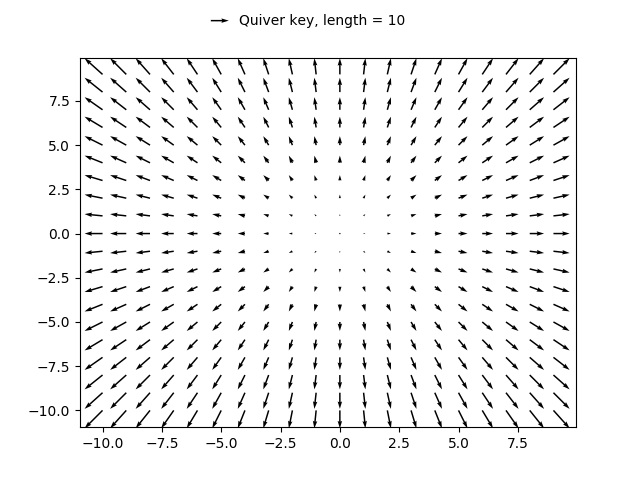
A simple example of a quiver plot with a quiverkey.

For more advanced options refer to Advanced quiver and quiverkey functions.

import matplotlib.pyplot as plt
import numpy as np

X = np.arange(-10, 10, 1)
Y = np.arange(-10, 10, 1)
U, V = np.meshgrid(X, Y)

fig, ax = plt.subplots()
q = ax.quiver(X, Y, U, V)
ax.quiverkey(q, X=0.3, Y=1.1, U=10,
             label='Quiver key, length = 10', labelpos='E')

plt.show()
../../_images/sphx_glr_quiver_simple_demo_001.png

References

The use of the following functions and methods is shown in this example:

import matplotlib
matplotlib.axes.Axes.quiver
matplotlib.pyplot.quiver
matplotlib.axes.Axes.quiverkey
matplotlib.pyplot.quiverkey

Out:

<function quiverkey at 0x7f18a5795e50>

Keywords: matplotlib code example, codex, python plot, pyplot Gallery generated by Sphinx-Gallery