Version 3.1.3
Note
Click here to download the full example code
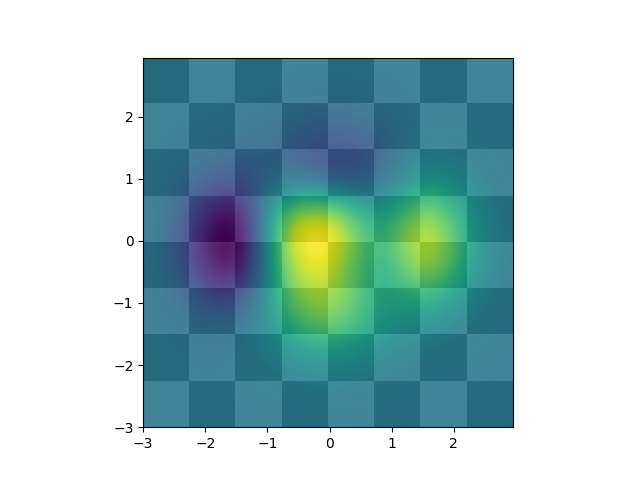
Layer images above one another using alpha blending
import matplotlib.pyplot as plt
import numpy as np


def func3(x, y):
    return (1 - x / 2 + x**5 + y**3) * np.exp(-(x**2 + y**2))


# make these smaller to increase the resolution
dx, dy = 0.05, 0.05

x = np.arange(-3.0, 3.0, dx)
y = np.arange(-3.0, 3.0, dy)
X, Y = np.meshgrid(x, y)

# when layering multiple images, the images need to have the same
# extent.  This does not mean they need to have the same shape, but
# they both need to render to the same coordinate system determined by
# xmin, xmax, ymin, ymax.  Note if you use different interpolations
# for the images their apparent extent could be different due to
# interpolation edge effects

extent = np.min(x), np.max(x), np.min(y), np.max(y)
fig = plt.figure(frameon=False)

Z1 = np.add.outer(range(8), range(8)) % 2  # chessboard
im1 = plt.imshow(Z1, cmap=plt.cm.gray, interpolation='nearest',
                 extent=extent)

Z2 = func3(X, Y)

im2 = plt.imshow(Z2, cmap=plt.cm.viridis, alpha=.9, interpolation='bilinear',
                 extent=extent)

plt.show()
The use of the following functions and methods is shown in this example:
import matplotlib
matplotlib.axes.Axes.imshow
matplotlib.pyplot.imshow
Out:
<function imshow at 0x7f18a5795550>
Keywords: matplotlib code example, codex, python plot, pyplot Gallery generated by Sphinx-Gallery