Version 3.1.3
Note
Click here to download the full example code
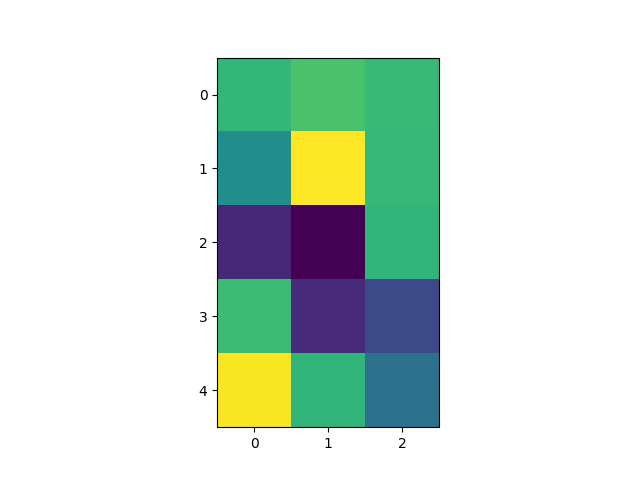
Modify the coordinate formatter to report the image "z"
value of the nearest pixel given x and y.
This functionality is built in by default, but it
is still useful to show how to customize the
format_coord function.
import numpy as np
import matplotlib.pyplot as plt

# Fixing random state for reproducibility
np.random.seed(19680801)


X = 10*np.random.rand(5, 3)

fig, ax = plt.subplots()
ax.imshow(X, interpolation='nearest')

numrows, numcols = X.shape


def format_coord(x, y):
    col = int(x + 0.5)
    row = int(y + 0.5)
    if col >= 0 and col < numcols and row >= 0 and row < numrows:
        z = X[row, col]
        return 'x=%1.4f, y=%1.4f, z=%1.4f' % (x, y, z)
    else:
        return 'x=%1.4f, y=%1.4f' % (x, y)

ax.format_coord = format_coord
plt.show()
The use of the following functions, methods, classes and modules is shown in this example:
import matplotlib
matplotlib.axes.Axes.format_coord
matplotlib.axes.Axes.imshow
Out:
<function Axes.imshow at 0x7f18a5a96280>
Keywords: matplotlib code example, codex, python plot, pyplot Gallery generated by Sphinx-Gallery