Version 3.1.3
Note
Click here to download the full example code
Illustrate some of the more advanced things that one can do with contour labels.
See also the contour demo example.
import matplotlib
import numpy as np
import matplotlib.ticker as ticker
import matplotlib.pyplot as plt
Define our surface
Make contour labels using creative float classes Follows suggestion of Manuel Metz
# Define a class that forces representation of float to look a certain way
# This remove trailing zero so '1.0' becomes '1'
class nf(float):
def __repr__(self):
s = f'{self:.1f}'
return f'{self:.0f}' if s[-1] == '0' else s
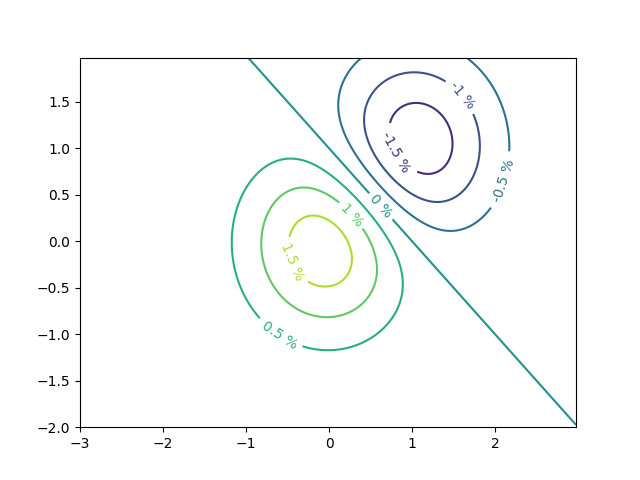
# Basic contour plot
fig, ax = plt.subplots()
CS = ax.contour(X, Y, Z)
# Recast levels to new class
CS.levels = [nf(val) for val in CS.levels]
# Label levels with specially formatted floats
if plt.rcParams["text.usetex"]:
fmt = r'%r \%%'
else:
fmt = '%r %%'
ax.clabel(CS, CS.levels, inline=True, fmt=fmt, fontsize=10)
Out:
<a list of 7 text.Text objects>
Label contours with arbitrary strings using a dictionary
fig1, ax1 = plt.subplots()

# Basic contour plot
CS1 = ax1.contour(X, Y, Z)

fmt = {}
strs = ['first', 'second', 'third', 'fourth', 'fifth', 'sixth', 'seventh']
for l, s in zip(CS1.levels, strs):
    fmt[l] = s

# Label every other level using strings
ax1.clabel(CS1, CS1.levels[::2], inline=True, fmt=fmt, fontsize=10)

Out:
<a list of 3 text.Text objects>
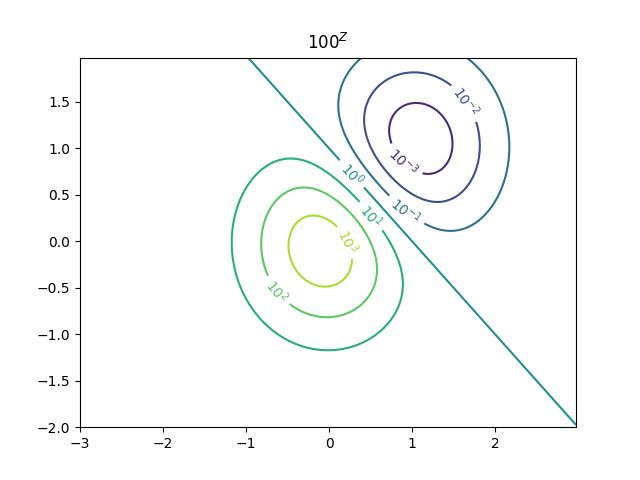
Use a Formatter
The use of the following functions, methods and classes is shown in this example:
matplotlib.axes.Axes.contour
matplotlib.pyplot.contour
matplotlib.axes.Axes.clabel
matplotlib.pyplot.clabel
matplotlib.ticker.LogFormatterMathtext
matplotlib.ticker.TickHelper.create_dummy_axis
Out:
<function TickHelper.create_dummy_axis at 0x7f18a849ba60>
Keywords: matplotlib code example, codex, python plot, pyplot Gallery generated by Sphinx-Gallery