Version 3.1.3
Note
Click here to download the full example code
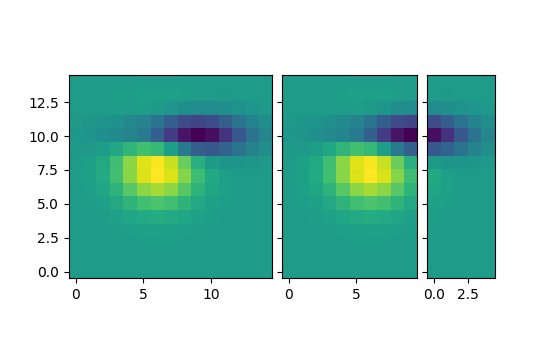
Align multiple images of different sizes using
ImageGrid.
import matplotlib.pyplot as plt
from mpl_toolkits.axes_grid1 import ImageGrid


def get_demo_image():
    import numpy as np
    from matplotlib.cbook import get_sample_data
    f = get_sample_data("axes_grid/bivariate_normal.npy", asfileobj=False)
    z = np.load(f)
    # z is a numpy array of 15x15
    return z, (-3, 4, -4, 3)


fig = plt.figure(figsize=(5.5, 3.5))
grid = ImageGrid(fig, 111,  # similar to subplot(111)
                 nrows_ncols=(1, 3),
                 axes_pad=0.1,
                 add_all=True,
                 label_mode="L",
                 )

Z, extent = get_demo_image()  # demo image

im1 = Z
im2 = Z[:, :10]
im3 = Z[:, 10:]
vmin, vmax = Z.min(), Z.max()
for ax, im in zip(grid, [im1, im2, im3]):
    ax.imshow(im, origin="lower", vmin=vmin, vmax=vmax,
              interpolation="nearest")

plt.show()
Keywords: matplotlib code example, codex, python plot, pyplot Gallery generated by Sphinx-Gallery