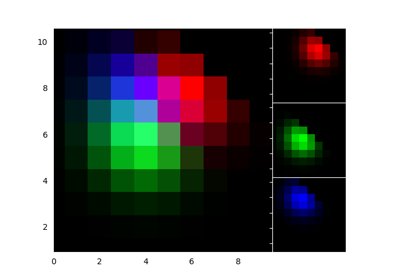
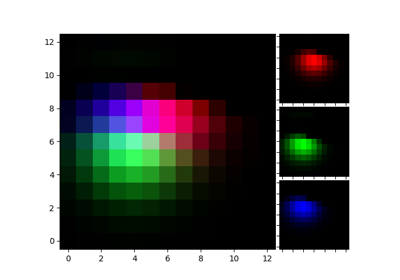
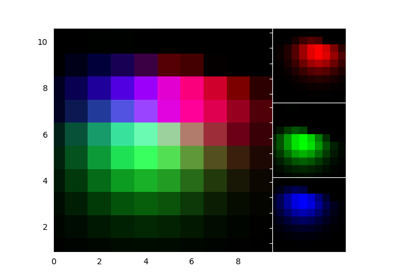
mpl_toolkits.axes_grid1.axes_rgb.RGBAxes
mpl_toolkits.axes_grid1.axes_rgb.
RGBAxes
Bases: mpl_toolkits.axes_grid1.axes_rgb.RGBAxesBase
mpl_toolkits.axes_grid1.axes_rgb.RGBAxesBase
fraction of the axes height to put as padding. defaults to 0.0
True: Add the {rgb, r, g, b} axes to the figure defaults to True.
Unpacked into axes_class() init for RGB
Unpacked into axes_class() init for RGB, R, G, B axes
Whats New 0.99 Axes Grid
Demo Axes RGB
Simple RGB