You are reading an old version of the documentation (v3.1.3). For the latest version see https://matplotlib.org/stable/api/_as_gen/matplotlib.pyplot.xcorr.html
Version 3.1.3
matplotlib
Fork me on GitHub

Table of Contents

matplotlib.pyplot.xcorr

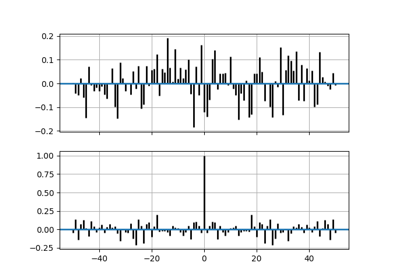
matplotlib.pyplot.xcorr(x, y, normed=True, detrend=<function detrend_none at 0x7f18a5ba4700>, usevlines=True, maxlags=10, *, data=None, **kwargs)[source]

Plot the cross correlation between x and y.

The correlation with lag k is defined as \(\sum_n x[n+k] \cdot y^*[n]\), where \(y^*\) is the complex conjugate of \(y\).

Parameters:
x : array-like of length n
y : array-like of length n
detrend : callable, optional, default: mlab.detrend_none

x and y are detrended by the detrend callable. This must be a function x = detrend(x) accepting and returning an numpy.array. Default is no normalization.

normed : bool, optional, default: True

If True, input vectors are normalised to unit length.

usevlines : bool, optional, default: True

Determines the plot style.

If True, vertical lines are plotted from 0 to the xcorr value using Axes.vlines. Additionally, a horizontal line is plotted at y=0 using Axes.axhline.

If False, markers are plotted at the xcorr values using Axes.plot.

maxlags : int, optional, default: 10

Number of lags to show. If None, will return all 2 * len(x) - 1 lags.

Returns:
lags : array (length 2*maxlags+1)

The lag vector.

c : array (length 2*maxlags+1)

The auto correlation vector.

line : LineCollection or Line2D

Artist added to the axes of the correlation:

b : Line2D or None

Horizontal line at 0 if usevlines is True None usevlines is False.

Other Parameters:
linestyle : Line2D property, optional

The linestyle for plotting the data points. Only used if usevlines is False.

marker : str, optional, default: 'o'

The marker for plotting the data points. Only used if usevlines is False.

Notes

The cross correlation is performed with numpy.correlate() with mode = "full".

Note

In addition to the above described arguments, this function can take a data keyword argument. If such a data argument is given, the following arguments are replaced by data[<arg>]:

  • All arguments with the following names: 'x', 'y'.

Objects passed as data must support item access (data[<arg>]) and membership test (<arg> in data).

Examples using matplotlib.pyplot.xcorr