Version 3.1.3
matplotlib.colors.DivergingNorm(vcenter, vmin=None, vmax=None)[source]¶Bases: matplotlib.colors.Normalize
Normalize data with a set center.
Useful when mapping data with an unequal rates of change around a conceptual center, e.g., data that range from -2 to 4, with 0 as the midpoint.
| Parameters: |
|
|---|
Examples
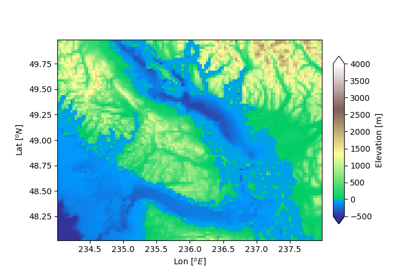
This maps data value -4000 to 0., 0 to 0.5, and +10000 to 1.0; data between is linearly interpolated:
>>> import matplotlib.colors as mcolors
>>> offset = mcolors.DivergingNorm(vmin=-4000.,
                                   vcenter=0., vmax=10000)
>>> data = [-4000., -2000., 0., 2500., 5000., 7500., 10000.]
>>> offset(data)
array([0., 0.25, 0.5, 0.625, 0.75, 0.875, 1.0])
matplotlib.colors.DivergingNorm