You are reading an old version of the documentation (v3.1.3). For the latest version see https://matplotlib.org/stable/api/_as_gen/matplotlib.axes.Axes.vlines.html
Version 3.1.3
matplotlib
Fork me on GitHub

Table of Contents

matplotlib.axes.Axes.vlines

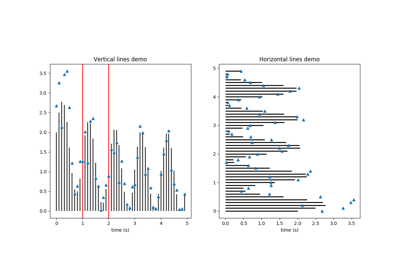
Axes.vlines(self, x, ymin, ymax, colors='k', linestyles='solid', label='', *, data=None, **kwargs)[source]

Plot vertical lines.

Plot vertical lines at each x from ymin to ymax.

Parameters:
x : scalar or 1D array_like

x-indexes where to plot the lines.

ymin, ymax : scalar or 1D array_like

Respective beginning and end of each line. If scalars are provided, all lines will have same length.

colors : array_like of colors, optional, default: 'k'
linestyles : {'solid', 'dashed', 'dashdot', 'dotted'}, optional
label : string, optional, default: ''
Returns:
lines : LineCollection
Other Parameters:
**kwargs : LineCollection properties.

See also

hlines
horizontal lines
axvline
vertical line across the axes

Notes

Note

In addition to the above described arguments, this function can take a data keyword argument. If such a data argument is given, the following arguments are replaced by data[<arg>]:

  • All arguments with the following names: 'colors', 'x', 'ymax', 'ymin'.

Objects passed as data must support item access (data[<arg>]) and membership test (<arg> in data).

Examples using matplotlib.axes.Axes.vlines