| Parameters: |
- x, y : 1D arrays
An evenly spaced grid.
- u, v : 2D arrays
x and y-velocities. The number of rows and columns must match
the length of y and x, respectively.
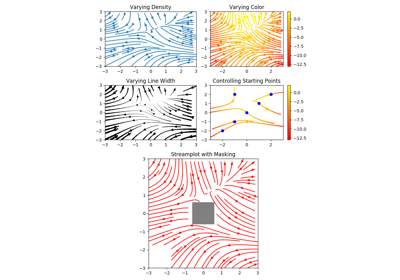
- density : float or (float, float)
Controls the closeness of streamlines. When density = 1, the domain
is divided into a 30x30 grid. density linearly scales this grid.
Each cell in the grid can have, at most, one traversing streamline.
For different densities in each direction, use a tuple
(density_x, density_y).
- linewidth : float or 2D array
The width of the stream lines. With a 2D array the line width can be
varied across the grid. The array must have the same shape as u
and v.
- color : matplotlib color code, or 2D array
The streamline color. If given an array, its values are converted to
colors using cmap and norm. The array must have the same shape
as u and v.
- cmap :
Colormap
Colormap used to plot streamlines and arrows. This is only used if
color is an array.
- norm :
Normalize
Normalize object used to scale luminance data to 0, 1. If None,
stretch (min, max) to (0, 1). This is only used if color is an array.
- arrowsize : float
Scaling factor for the arrow size.
- arrowstyle : str
Arrow style specification.
See FancyArrowPatch.
- minlength : float
Minimum length of streamline in axes coordinates.
- start_points : Nx2 array
Coordinates of starting points for the streamlines in data coordinates
(the same coordinates as the x and y arrays).
- zorder : int
The zorder of the stream lines and arrows.
Artists with lower zorder values are drawn first.
- maxlength : float
Maximum length of streamline in axes coordinates.
- integration_direction : {'forward', 'backward', 'both'}
Integrate the streamline in forward, backward or both directions.
default is 'both'.
|
|---|