Plot a 2D field of barbs.
Call signature:
barbs([X, Y], U, V, [C], **kw)
Where X, Y define the barb locations, U, V define the barb
directions, and C optionally sets the color.
All arguments may be 1D or 2D. U, V, C may be masked arrays, but masked
X, Y are not supported at present.
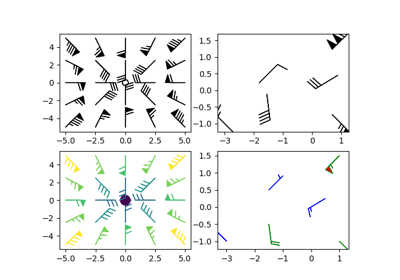
Barbs are traditionally used in meteorology as a way to plot the speed
and direction of wind observations, but can technically be used to
plot any two dimensional vector quantity. As opposed to arrows, which
give vector magnitude by the length of the arrow, the barbs give more
quantitative information about the vector magnitude by putting slanted
lines or a triangle for various increments in magnitude, as show
schematically below:
:                   /\    \
:                  /  \    \
:                 /    \    \    \
:                /      \    \    \
:               ------------------------------
The largest increment is given by a triangle (or "flag"). After those
come full lines (barbs). The smallest increment is a half line. There
is only, of course, ever at most 1 half line. If the magnitude is
small and only needs a single half-line and no full lines or
triangles, the half-line is offset from the end of the barb so that it
can be easily distinguished from barbs with a single full line. The
magnitude for the barb shown above would nominally be 65, using the
standard increments of 50, 10, and 5.
See also https://en.wikipedia.org/wiki/Wind_barb.
| Parameters: |
- X, Y : 1D or 2D array-like, optional
The x and y coordinates of the barb locations. See pivot for how the
barbs are drawn to the x, y positions.
If not given, they will be generated as a uniform integer meshgrid based
on the dimensions of U and V.
If X and Y are 1D but U, V are 2D, X, Y are expanded to 2D
using X, Y = np.meshgrid(X, Y). In this case len(X) and len(Y)
must match the column and row dimensions of U and V.
- U, V : 1D or 2D array-like
The x and y components of the barb shaft.
- C : 1D or 2D array-like, optional
Numeric data that defines the barb colors by colormapping via norm and
cmap.
This does not support explicit colors. If you want to set colors directly,
use barbcolor instead.
- length : float, default: 7
Length of the barb in points; the other parts of the barb
are scaled against this.
- pivot : {'tip', 'middle'} or float, default: 'tip'
The part of the arrow that is anchored to the X, Y grid. The barb
rotates about this point. This can also be a number, which shifts the
start of the barb that many points away from grid point.
- barbcolor : color or color sequence
Specifies the color of all parts of the barb except for the flags. This
parameter is analogous to the edgecolor parameter for polygons,
which can be used instead. However this parameter will override
facecolor.
- flagcolor : color or color sequence
Specifies the color of any flags on the barb. This parameter is
analogous to the facecolor parameter for polygons, which can be
used instead. However, this parameter will override facecolor. If
this is not set (and C has not either) then flagcolor will be
set to match barbcolor so that the barb has a uniform color. If
C has been set, flagcolor has no effect.
- sizes : dict, optional
A dictionary of coefficients specifying the ratio of a given
feature to the length of the barb. Only those values one wishes to
override need to be included. These features include:
- 'spacing' - space between features (flags, full/half barbs)
- 'height' - height (distance from shaft to top) of a flag or full barb
- 'width' - width of a flag, twice the width of a full barb
- 'emptybarb' - radius of the circle used for low magnitudes
- fill_empty : bool, default: False
Whether the empty barbs (circles) that are drawn should be filled with
the flag color. If they are not filled, the center is transparent.
- rounding : bool, default: True
Whether the vector magnitude should be rounded when allocating barb
components. If True, the magnitude is rounded to the nearest multiple
of the half-barb increment. If False, the magnitude is simply truncated
to the next lowest multiple.
- barb_increments : dict, optional
A dictionary of increments specifying values to associate with
different parts of the barb. Only those values one wishes to
override need to be included.
- 'half' - half barbs (Default is 5)
- 'full' - full barbs (Default is 10)
- 'flag' - flags (default is 50)
- flip_barb : bool or array-like of bool, default: False
Whether the lines and flags should point opposite to normal.
Normal behavior is for the barbs and lines to point right (comes from wind
barbs having these features point towards low pressure in the Northern
Hemisphere).
A single value is applied to all barbs. Individual barbs can be flipped by
passing a bool array of the same size as U and V.
|
|---|
| Returns: |
- barbs :
Barbs
|
|---|
| Other Parameters: |
- **kwargs
The barbs can further be customized using PolyCollection keyword
arguments:
| Property |
Description |
|---|
agg_filter |
a filter function, which takes a (m, n, 3) float array and a dpi value, and returns a (m, n, 3) array |
alpha |
float or None |
animated |
bool |
antialiased or aa or antialiaseds |
bool or sequence of bools |
array |
ndarray |
capstyle |
{'butt', 'round', 'projecting'} |
clim |
a length 2 sequence of floats; may be overridden in methods that have vmin and vmax kwargs. |
clip_box |
Bbox |
clip_on |
bool |
clip_path |
[(Path, Transform) | Patch | None] |
cmap |
colormap or registered colormap name |
color |
color or sequence of rgba tuples |
contains |
callable |
edgecolor or ec or edgecolors |
color or sequence of colors or 'face' |
facecolor or facecolors or fc |
color or sequence of colors |
figure |
Figure |
gid |
str |
hatch |
{'/', '\', '|', '-', '+', 'x', 'o', 'O', '.', '*'} |
in_layout |
bool |
joinstyle |
{'miter', 'round', 'bevel'} |
label |
object |
linestyle or dashes or linestyles or ls |
{'-', '--', '-.', ':', '', (offset, on-off-seq), ...} |
linewidth or linewidths or lw |
float or sequence of floats |
norm |
Normalize |
offset_position |
{'screen', 'data'} |
offsets |
float or sequence of floats |
path_effects |
AbstractPathEffect |
picker |
None or bool or float or callable |
pickradius |
unknown |
rasterized |
bool or None |
sketch_params |
(scale: float, length: float, randomness: float) |
snap |
bool or None |
transform |
Transform |
url |
str |
urls |
List[str] or None |
visible |
bool |
zorder |
float |
|
|---|
Notes
Note
In addition to the above described arguments, this function can take a
data keyword argument. If such a data argument is given, the
following arguments are replaced by data[<arg>]:
- All positional and all keyword arguments.
Objects passed as data must support item access (data[<arg>]) and
membership test (<arg> in data).