Version 3.1.2
Note
Click here to download the full example code
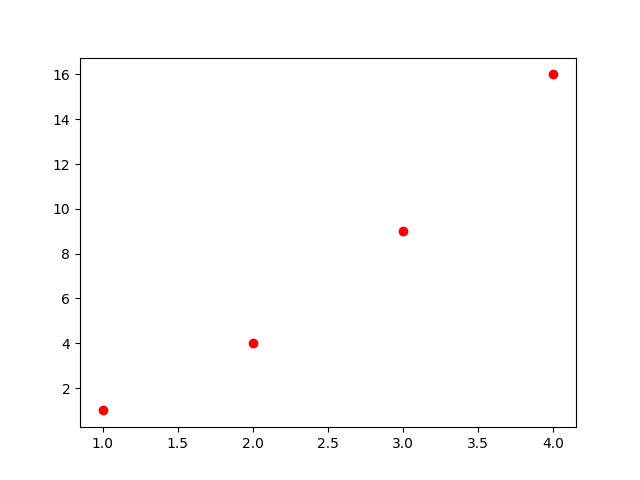
Use a format string (here, 'ro') to set the color and markers of a
plot.
The use of the following functions, methods, classes and modules is shown in this example:
import matplotlib
matplotlib.pyplot.plot
matplotlib.axes.Axes.plot
Out:
<function Axes.plot at 0x7fb11b4499d8>
Keywords: matplotlib code example, codex, python plot, pyplot Gallery generated by Sphinx-Gallery