You are reading an old version of the documentation (v3.1.1). For the latest version see https://matplotlib.org/stable/api/_as_gen/matplotlib.colors.BoundaryNorm.html
Version 3.1.2
matplotlib
Fork me on GitHub

Table of Contents

matplotlib.colors.BoundaryNorm

class 
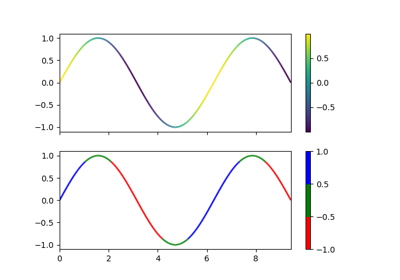
matplotlib.colors.BoundaryNorm(boundaries, ncolors, clip=False)[source]

Bases: matplotlib.colors.Normalize

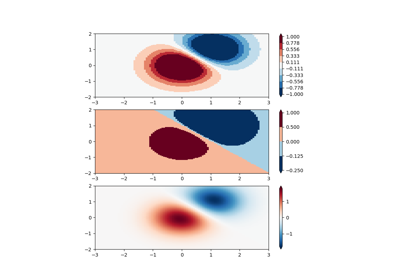
Generate a colormap index based on discrete intervals.

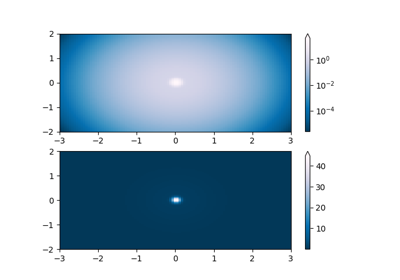
Unlike Normalize or LogNorm, BoundaryNorm maps values to integers instead of to the interval 0-1.

Mapping to the 0-1 interval could have been done via piece-wise linear interpolation, but using integers seems simpler, and reduces the number of conversions back and forth between integer and floating point.

Parameters:
boundaries : array-like

Monotonically increasing sequence of boundaries

ncolors : int

Number of colors in the colormap to be used

clip : bool, optional

If clip is True, out of range values are mapped to 0 if they are below boundaries[0] or mapped to ncolors - 1 if they are above boundaries[-1].

If clip is False, out of range values are mapped to -1 if they are below boundaries[0] or mapped to ncolors if they are above boundaries[-1]. These are then converted to valid indices by Colormap.__call__().

Notes

boundaries defines the edges of bins, and data falling within a bin is mapped to the color with the same index.

If the number of bins doesn't equal ncolors, the color is chosen by linear interpolation of the bin number onto color numbers.

inverse(self, value)[source]
Raises:
ValueError

BoundaryNorm is not invertible, so calling this method will always raise an error