Version 3.1.2
Axes.secondary_xaxis(self, location, *, functions=None, **kwargs)[source]¶Add a second x-axis to this axes.
For example if we want to have a second scale for the data plotted on the xaxis.
| Parameters: |
|
|---|---|
| Returns: |
|
| Other Parameters: |
|
Warning
This method is experimental as of 3.1, and the API may change.
Examples
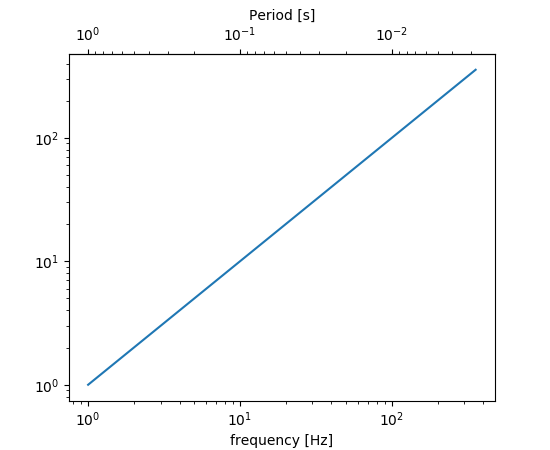
The main axis shows frequency, and the secondary axis shows period.
(Source code, png, pdf)

matplotlib.axes.Axes.secondary_xaxis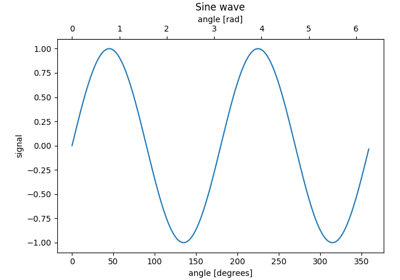