You are reading an old version of the documentation (v3.1.1). For the latest version see https://matplotlib.org/stable/api/_as_gen/matplotlib.axes.Axes.bar.html
Version 3.1.2
matplotlib
Fork me on GitHub

Table of Contents

matplotlib.axes.Axes.bar

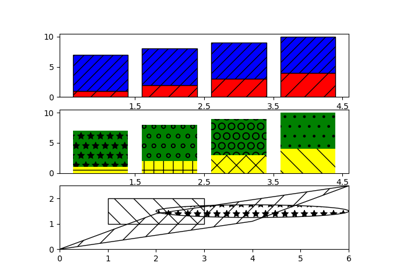
Axes.bar(self, x, height, width=0.8, bottom=None, *, align='center', data=None, **kwargs)[source]

Make a bar plot.

The bars are positioned at x with the given alignment. Their dimensions are given by width and height. The vertical baseline is bottom (default 0).

Each of x, height, width, and bottom may either be a scalar applying to all bars, or it may be a sequence of length N providing a separate value for each bar.

Parameters:
x : sequence of scalars

The x coordinates of the bars. See also align for the alignment of the bars to the coordinates.

height : scalar or sequence of scalars

The height(s) of the bars.

width : scalar or array-like, optional

The width(s) of the bars (default: 0.8).

bottom : scalar or array-like, optional

The y coordinate(s) of the bars bases (default: 0).

align : {'center', 'edge'}, optional, default: 'center'

Alignment of the bars to the x coordinates:

  • 'center': Center the base on the x positions.
  • 'edge': Align the left edges of the bars with the x positions.

To align the bars on the right edge pass a negative width and align='edge'.

Returns:
container : BarContainer

Container with all the bars and optionally errorbars.

Other Parameters:
color : scalar or array-like, optional

The colors of the bar faces.

edgecolor : scalar or array-like, optional

The colors of the bar edges.

linewidth : scalar or array-like, optional

Width of the bar edge(s). If 0, don't draw edges.

tick_label : string or array-like, optional

The tick labels of the bars. Default: None (Use default numeric labels.)

xerr, yerr : scalar or array-like of shape(N,) or shape(2,N), optional

If not None, add horizontal / vertical errorbars to the bar tips. The values are +/- sizes relative to the data:

  • scalar: symmetric +/- values for all bars
  • shape(N,): symmetric +/- values for each bar
  • shape(2,N): Separate - and + values for each bar. First row
    contains the lower errors, the second row contains the upper errors.
  • None: No errorbar. (Default)

See Different ways of specifying error bars for an example on the usage of xerr and yerr.

ecolor : scalar or array-like, optional, default: 'black'

The line color of the errorbars.

capsize : scalar, optional

The length of the error bar caps in points. Default: None, which will take the value from rcParams["errorbar.capsize"] = 0.0.

error_kw : dict, optional

Dictionary of kwargs to be passed to the errorbar method. Values of ecolor or capsize defined here take precedence over the independent kwargs.

log : bool, optional, default: False

If True, set the y-axis to be log scale.

orientation : {'vertical', 'horizontal'}, optional

This is for internal use only. Please use barh for horizontal bar plots. Default: 'vertical'.

See also

barh
Plot a horizontal bar plot.

Notes

The optional arguments color, edgecolor, linewidth, xerr, and yerr can be either scalars or sequences of length equal to the number of bars. This enables you to use bar as the basis for stacked bar charts, or candlestick plots. Detail: xerr and yerr are passed directly to errorbar(), so they can also have shape 2xN for independent specification of lower and upper errors.

Other optional kwargs:

Property Description
agg_filter a filter function, which takes a (m, n, 3) float array and a dpi value, and returns a (m, n, 3) array
alpha float or None
animated bool
antialiased or aa unknown
capstyle {'butt', 'round', 'projecting'}
clip_box Bbox
clip_on bool
clip_path [(Path, Transform) | Patch | None]
color color
contains callable
edgecolor or ec color or None or 'auto'
facecolor or fc color or None
figure Figure
fill bool
gid str
hatch {'/', '\', '|', '-', '+', 'x', 'o', 'O', '.', '*'}
in_layout bool
joinstyle {'miter', 'round', 'bevel'}
label object
linestyle or ls {'-', '--', '-.', ':', '', (offset, on-off-seq), ...}
linewidth or lw float or None
path_effects AbstractPathEffect
picker None or bool or float or callable
rasterized bool or None
sketch_params (scale: float, length: float, randomness: float)
snap bool or None
transform Transform
url str
visible bool
zorder float

Note

In addition to the above described arguments, this function can take a data keyword argument. If such a data argument is given, the following arguments are replaced by data[<arg>]:

  • All positional and all keyword arguments.

Objects passed as data must support item access (data[<arg>]) and membership test (<arg> in data).