Version 3.1.0
Note
Click here to download the full example code
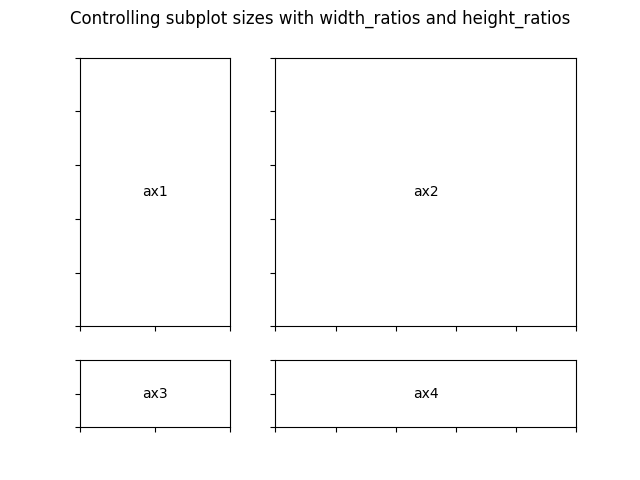
This example demonstrates the use of GridSpec to generate subplots,
the control of the relative sizes of subplots with width_ratios and
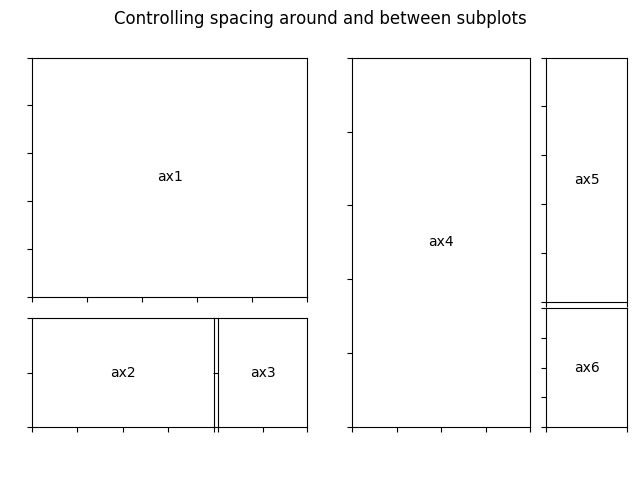
height_ratios, and the control of the spacing around and between subplots
using subplot params (left, right, bottom, top, wspace, and
hspace).
import matplotlib.pyplot as plt
from matplotlib.gridspec import GridSpec


def annotate_axes(fig):
    for i, ax in enumerate(fig.axes):
        ax.text(0.5, 0.5, "ax%d" % (i+1), va="center", ha="center")
        ax.tick_params(labelbottom=False, labelleft=False)


fig = plt.figure()
fig.suptitle("Controlling subplot sizes with width_ratios and height_ratios")

gs = GridSpec(2, 2, width_ratios=[1, 2], height_ratios=[4, 1])
ax1 = fig.add_subplot(gs[0])
ax2 = fig.add_subplot(gs[1])
ax3 = fig.add_subplot(gs[2])
ax4 = fig.add_subplot(gs[3])

annotate_axes(fig)


fig = plt.figure()
fig.suptitle("Controlling spacing around and between subplots")

gs1 = GridSpec(3, 3, left=0.05, right=0.48, wspace=0.05)
ax1 = fig.add_subplot(gs1[:-1, :])
ax2 = fig.add_subplot(gs1[-1, :-1])
ax3 = fig.add_subplot(gs1[-1, -1])

gs2 = GridSpec(3, 3, left=0.55, right=0.98, hspace=0.05)
ax4 = fig.add_subplot(gs2[:, :-1])
ax5 = fig.add_subplot(gs2[:-1, -1])
ax6 = fig.add_subplot(gs2[-1, -1])

annotate_axes(fig)

plt.show()
Keywords: matplotlib code example, codex, python plot, pyplot Gallery generated by Sphinx-Gallery