Version 3.1.0
Note
Click here to download the full example code
import numpy as np
import matplotlib.pyplot as plt
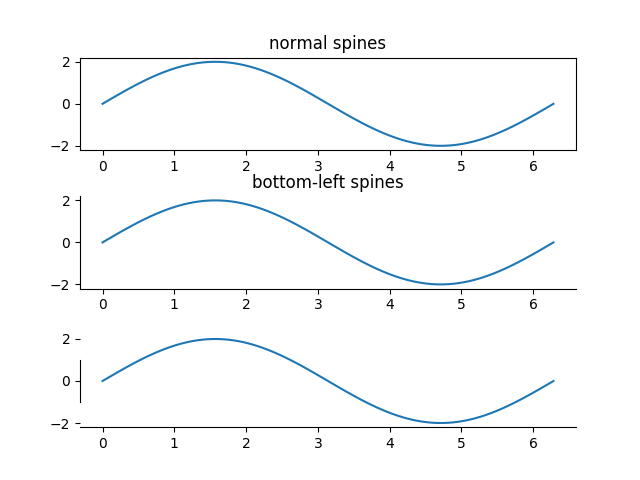
x = np.linspace(0, 2 * np.pi, 100)
y = 2 * np.sin(x)
fig, (ax0, ax1, ax2) = plt.subplots(nrows=3)
ax0.plot(x, y)
ax0.set_title('normal spines')
ax1.plot(x, y)
ax1.set_title('bottom-left spines')
# Hide the right and top spines
ax1.spines['right'].set_visible(False)
ax1.spines['top'].set_visible(False)
# Only show ticks on the left and bottom spines
ax1.yaxis.set_ticks_position('left')
ax1.xaxis.set_ticks_position('bottom')
ax2.plot(x, y)
# Only draw spine between the y-ticks
ax2.spines['left'].set_bounds(-1, 1)
# Hide the right and top spines
ax2.spines['right'].set_visible(False)
ax2.spines['top'].set_visible(False)
# Only show ticks on the left and bottom spines
ax2.yaxis.set_ticks_position('left')
ax2.xaxis.set_ticks_position('bottom')
# Tweak spacing between subplots to prevent labels from overlapping
plt.subplots_adjust(hspace=0.5)
plt.show()
Keywords: matplotlib code example, codex, python plot, pyplot Gallery generated by Sphinx-Gallery