Version 3.1.0
Note
Click here to download the full example code
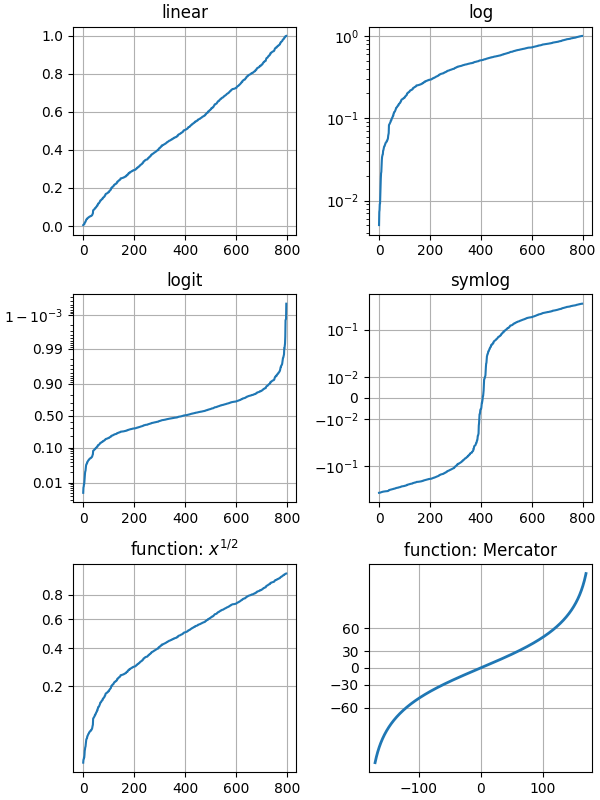
Illustrate the scale transformations applied to axes, e.g. log, symlog, logit.
The last two examples are examples of using the 'function' scale by
supplying forward and inverse functions for the scale transformation.
import numpy as np
import matplotlib.pyplot as plt
from matplotlib.ticker import NullFormatter, FixedLocator

# Fixing random state for reproducibility
np.random.seed(19680801)

# make up some data in the interval ]0, 1[
y = np.random.normal(loc=0.5, scale=0.4, size=1000)
y = y[(y > 0) & (y < 1)]
y.sort()
x = np.arange(len(y))

# plot with various axes scales
fig, axs = plt.subplots(3, 2, figsize=(6, 8),
                        constrained_layout=True)

# linear
ax = axs[0, 0]
ax.plot(x, y)
ax.set_yscale('linear')
ax.set_title('linear')
ax.grid(True)


# log
ax = axs[0, 1]
ax.plot(x, y)
ax.set_yscale('log')
ax.set_title('log')
ax.grid(True)


# symmetric log
ax = axs[1, 1]
ax.plot(x, y - y.mean())
ax.set_yscale('symlog', linthreshy=0.02)
ax.set_title('symlog')
ax.grid(True)

# logit
ax = axs[1, 0]
ax.plot(x, y)
ax.set_yscale('logit')
ax.set_title('logit')
ax.grid(True)
ax.yaxis.set_minor_formatter(NullFormatter())


# Function x**(1/2)
def forward(x):
    return x**(1/2)


def inverse(x):
    return x**2


ax = axs[2, 0]
ax.plot(x, y)
ax.set_yscale('function', functions=(forward, inverse))
ax.set_title('function: $x^{1/2}$')
ax.grid(True)
ax.yaxis.set_major_locator(FixedLocator(np.arange(0, 1, 0.2)**2))
ax.yaxis.set_major_locator(FixedLocator(np.arange(0, 1, 0.2)))


# Function Mercator transform
def forward(a):
    a = np.deg2rad(a)
    return np.rad2deg(np.log(np.abs(np.tan(a) + 1.0 / np.cos(a))))


def inverse(a):
    a = np.deg2rad(a)
    return np.rad2deg(np.arctan(np.sinh(a)))

ax = axs[2, 1]

t = np.arange(-170.0, 170.0, 0.1)
s = t / 2.

ax.plot(t, s, '-', lw=2)

ax.set_yscale('function', functions=(forward, inverse))
ax.set_title('function: Mercator')
ax.grid(True)
ax.set_xlim([-180, 180])
ax.yaxis.set_minor_formatter(NullFormatter())
ax.yaxis.set_major_locator(FixedLocator(np.arange(-90, 90, 30)))

plt.show()
The use of the following functions, methods, classes and modules is shown in this example:
Keywords: matplotlib code example, codex, python plot, pyplot Gallery generated by Sphinx-Gallery