You are reading an old version of the documentation (v3.1.0). For the latest version see https://matplotlib.org/stable/gallery/pyplots/pyplot_three.html
Version 3.1.0
matplotlib
Fork me on GitHub

Table of Contents

Related Topics

Pyplot Three

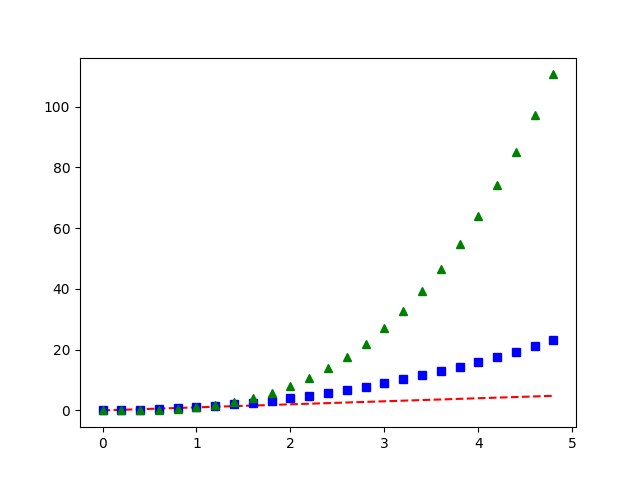
Plot three line plots in a single call to plot.

import numpy as np
import matplotlib.pyplot as plt

# evenly sampled time at 200ms intervals
t = np.arange(0., 5., 0.2)

# red dashes, blue squares and green triangles
plt.plot(t, t, 'r--', t, t**2, 'bs', t, t**3, 'g^')
plt.show()
../../_images/sphx_glr_pyplot_three_001.png

References

The use of the following functions, methods, classes and modules is shown in this example:

Keywords: matplotlib code example, codex, python plot, pyplot Gallery generated by Sphinx-Gallery