Version 3.1.0
Note
Click here to download the full example code
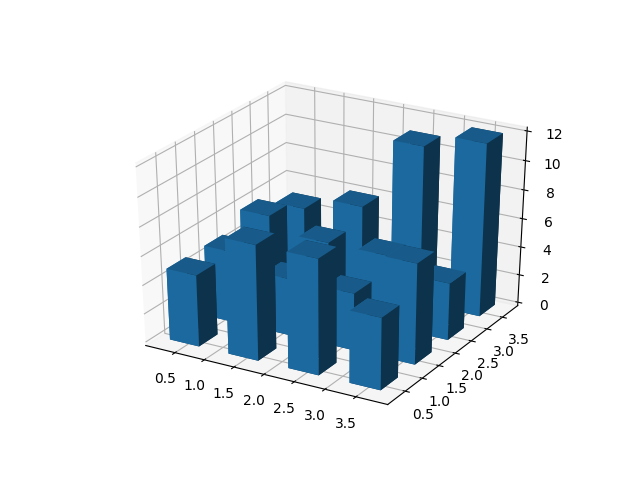
Demo of a histogram for 2 dimensional data as a bar graph in 3D.
# This import registers the 3D projection, but is otherwise unused.
from mpl_toolkits.mplot3d import Axes3D  # noqa: F401 unused import

import matplotlib.pyplot as plt
import numpy as np

# Fixing random state for reproducibility
np.random.seed(19680801)


fig = plt.figure()
ax = fig.add_subplot(111, projection='3d')
x, y = np.random.rand(2, 100) * 4
hist, xedges, yedges = np.histogram2d(x, y, bins=4, range=[[0, 4], [0, 4]])

# Construct arrays for the anchor positions of the 16 bars.
xpos, ypos = np.meshgrid(xedges[:-1] + 0.25, yedges[:-1] + 0.25, indexing="ij")
xpos = xpos.ravel()
ypos = ypos.ravel()
zpos = 0

# Construct arrays with the dimensions for the 16 bars.
dx = dy = 0.5 * np.ones_like(zpos)
dz = hist.ravel()

ax.bar3d(xpos, ypos, zpos, dx, dy, dz, zsort='average')

plt.show()
Keywords: matplotlib code example, codex, python plot, pyplot Gallery generated by Sphinx-Gallery