Version 3.1.0
Note
Click here to download the full example code
The default drawing order for axes is patches, lines, text. This order is determined by the zorder attribute. The following defaults are set
| Artist | Z-order |
|---|---|
| Patch / PatchCollection | 1 |
| Line2D / LineCollection | 2 |
| Text | 3 |
You can change the order for individual artists by setting the zorder. Any individual plot() call can set a value for the zorder of that particular item.
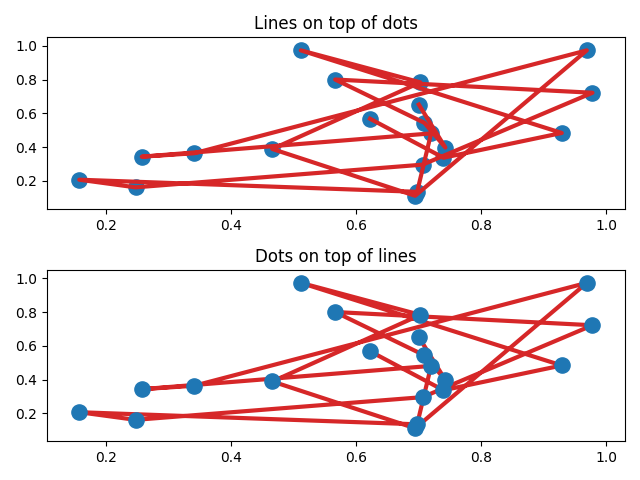
In the fist subplot below, the lines are drawn above the patch collection from the scatter, which is the default.
In the subplot below, the order is reversed.
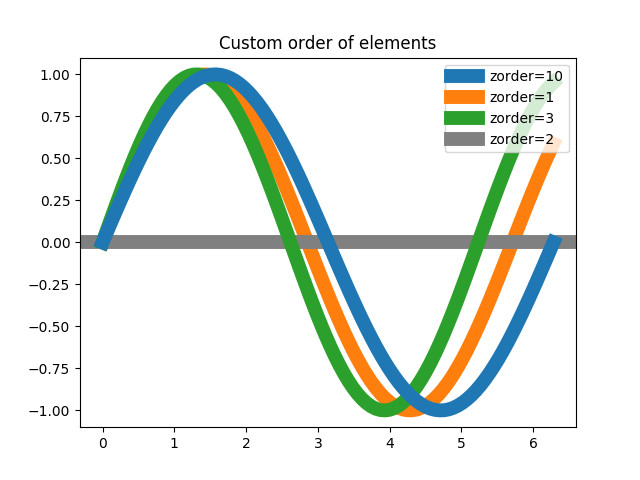
The second figure shows how to control the zorder of individual lines.
import matplotlib.pyplot as plt
import numpy as np

# Fixing random state for reproducibility
np.random.seed(19680801)


x = np.random.random(20)
y = np.random.random(20)
Lines on top of scatter
plt.figure()
plt.subplot(211)
plt.plot(x, y, 'C3', lw=3)
plt.scatter(x, y, s=120)
plt.title('Lines on top of dots')

# Scatter plot on top of lines
plt.subplot(212)
plt.plot(x, y, 'C3', zorder=1, lw=3)
plt.scatter(x, y, s=120, zorder=2)
plt.title('Dots on top of lines')
plt.tight_layout()
A new figure, with individually ordered items
x = np.linspace(0, 2*np.pi, 100)
plt.rcParams['lines.linewidth'] = 10
plt.figure()
plt.plot(x, np.sin(x), label='zorder=10', zorder=10)  # on top
plt.plot(x, np.sin(1.1*x), label='zorder=1', zorder=1)  # bottom
plt.plot(x, np.sin(1.2*x), label='zorder=3',  zorder=3)
plt.axhline(0, label='zorder=2', color='grey', zorder=2)
plt.title('Custom order of elements')
l = plt.legend(loc='upper right')
l.set_zorder(20)  # put the legend on top
plt.show()
Keywords: matplotlib code example, codex, python plot, pyplot Gallery generated by Sphinx-Gallery