Version 3.1.0
Note
Click here to download the full example code
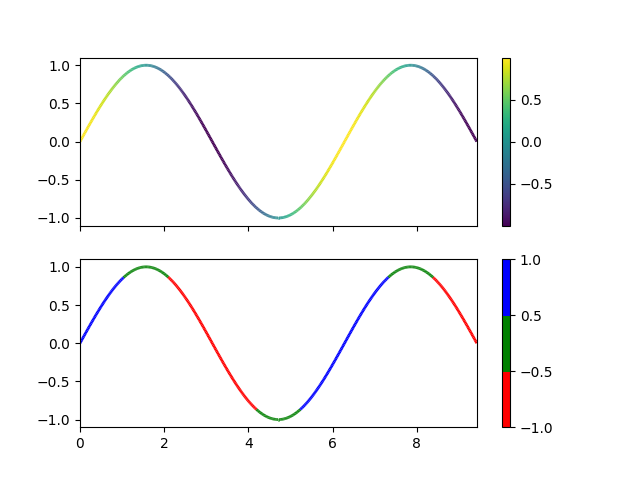
This example shows how to make a multi-colored line. In this example, the line is colored based on its derivative.
import numpy as np
import matplotlib.pyplot as plt
from matplotlib.collections import LineCollection
from matplotlib.colors import ListedColormap, BoundaryNorm

x = np.linspace(0, 3 * np.pi, 500)
y = np.sin(x)
dydx = np.cos(0.5 * (x[:-1] + x[1:]))  # first derivative

# Create a set of line segments so that we can color them individually
# This creates the points as a N x 1 x 2 array so that we can stack points
# together easily to get the segments. The segments array for line collection
# needs to be (numlines) x (points per line) x 2 (for x and y)
points = np.array([x, y]).T.reshape(-1, 1, 2)
segments = np.concatenate([points[:-1], points[1:]], axis=1)

fig, axs = plt.subplots(2, 1, sharex=True, sharey=True)

# Create a continuous norm to map from data points to colors
norm = plt.Normalize(dydx.min(), dydx.max())
lc = LineCollection(segments, cmap='viridis', norm=norm)
# Set the values used for colormapping
lc.set_array(dydx)
lc.set_linewidth(2)
line = axs[0].add_collection(lc)
fig.colorbar(line, ax=axs[0])

# Use a boundary norm instead
cmap = ListedColormap(['r', 'g', 'b'])
norm = BoundaryNorm([-1, -0.5, 0.5, 1], cmap.N)
lc = LineCollection(segments, cmap=cmap, norm=norm)
lc.set_array(dydx)
lc.set_linewidth(2)
line = axs[1].add_collection(lc)
fig.colorbar(line, ax=axs[1])

axs[0].set_xlim(x.min(), x.max())
axs[0].set_ylim(-1.1, 1.1)
plt.show()
Keywords: matplotlib code example, codex, python plot, pyplot Gallery generated by Sphinx-Gallery