Version 3.1.0
Note
Click here to download the full example code
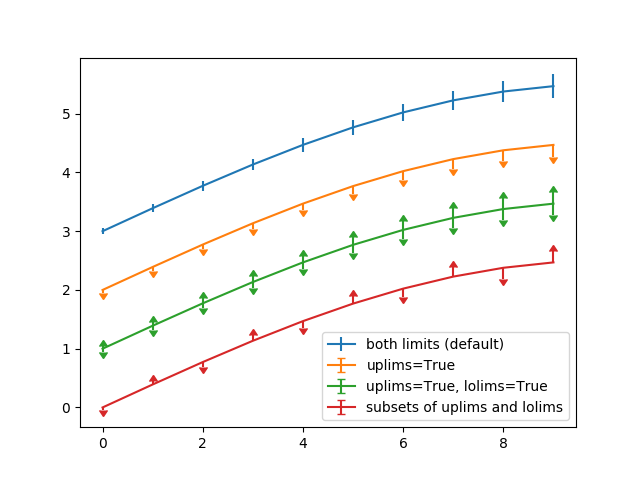
Illustration of selectively drawing lower and/or upper limit symbols on
errorbars using the parameters uplims, lolims of errorbar.
Alternatively, you can use 2xN values to draw errorbars in only one direction.
import numpy as np
import matplotlib.pyplot as plt


fig = plt.figure()
x = np.arange(10)
y = 2.5 * np.sin(x / 20 * np.pi)
yerr = np.linspace(0.05, 0.2, 10)

plt.errorbar(x, y + 3, yerr=yerr, label='both limits (default)')

plt.errorbar(x, y + 2, yerr=yerr, uplims=True, label='uplims=True')

plt.errorbar(x, y + 1, yerr=yerr, uplims=True, lolims=True,
             label='uplims=True, lolims=True')

upperlimits = [True, False] * 5
lowerlimits = [False, True] * 5
plt.errorbar(x, y, yerr=yerr, uplims=upperlimits, lolims=lowerlimits,
             label='subsets of uplims and lolims')

plt.legend(loc='lower right')
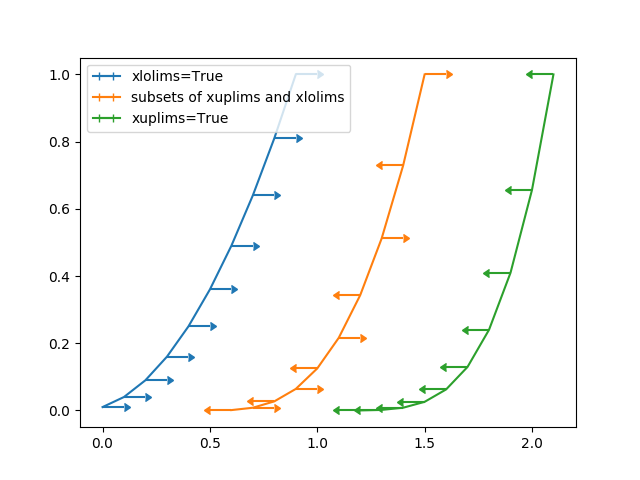
Similarly xuplims``and ``xlolims can be used on the horizontal xerr
errorbars.
fig = plt.figure()
x = np.arange(10) / 10
y = (x + 0.1)**2

plt.errorbar(x, y, xerr=0.1, xlolims=True, label='xlolims=True')
y = (x + 0.1)**3

plt.errorbar(x + 0.6, y, xerr=0.1, xuplims=upperlimits, xlolims=lowerlimits,
             label='subsets of xuplims and xlolims')

y = (x + 0.1)**4
plt.errorbar(x + 1.2, y, xerr=0.1, xuplims=True, label='xuplims=True')

plt.legend()
plt.show()
The use of the following functions, methods, classes and modules is shown in this example:
import matplotlib
matplotlib.axes.Axes.errorbar
matplotlib.pyplot.errorbar
Keywords: matplotlib code example, codex, python plot, pyplot Gallery generated by Sphinx-Gallery