| Parameters: |
- x, y : 1d arrays
An evenly spaced grid.
- u, v : 2d arrays
x and y-velocities. Number of rows should match length of y, and
the number of columns should match x.
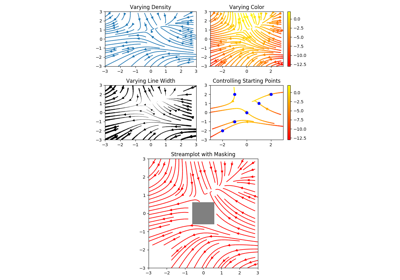
- density : float or 2-tuple
Controls the closeness of streamlines. When density = 1, the domain
is divided into a 30x30 grid---density linearly scales this grid.
Each cell in the grid can have, at most, one traversing streamline.
For different densities in each direction, use [density_x, density_y].
- linewidth : numeric or 2d array
Vary linewidth when given a 2d array with the same shape as velocities.
- color : matplotlib color code, or 2d array
Streamline color. When given an array with the same shape as
velocities, color values are converted to colors using cmap.
- cmap :
Colormap
Colormap used to plot streamlines and arrows. Only necessary when using
an array input for color.
- norm :
Normalize
Normalize object used to scale luminance data to 0, 1. If None,
stretch (min, max) to (0, 1). Only necessary when color is an array.
- arrowsize : float
Factor scale arrow size.
- arrowstyle : str
Arrow style specification.
See FancyArrowPatch.
- minlength : float
Minimum length of streamline in axes coordinates.
- start_points : Nx2 array
Coordinates of starting points for the streamlines.
In data coordinates, the same as the x and y arrays.
- zorder : int
Any number.
- maxlength : float
Maximum length of streamline in axes coordinates.
- integration_direction : ['forward' | 'backward' | 'both']
Integrate the streamline in forward, backward or both directions.
default is 'both'.
|
|---|