You are reading an old version of the documentation (v3.1.0). For the latest version see https://matplotlib.org/stable/api/_as_gen/matplotlib.pyplot.pcolormesh.html
Version 3.1.0
matplotlib
Fork me on GitHub

Table of Contents

matplotlib.pyplot.pcolormesh

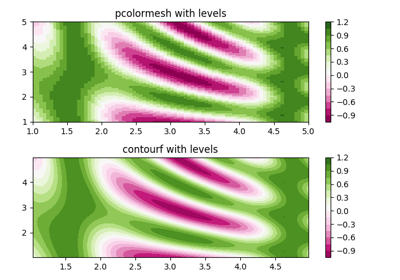
matplotlib.pyplot.pcolormesh(*args, alpha=None, norm=None, cmap=None, vmin=None, vmax=None, shading='flat', antialiased=False, data=None, **kwargs)[source]

Create a pseudocolor plot with a non-regular rectangular grid.

Call signature:

pcolor([X, Y,] C, **kwargs)

X and Y can be used to specify the corners of the quadrilaterals.

Note

pcolormesh() is similar to pcolor(). It's much faster and preferred in most cases. For a detailed discussion on the differences see Differences between pcolor() and pcolormesh().

Parameters:
C : array_like

A scalar 2-D array. The values will be color-mapped.

X, Y : array_like, optional

The coordinates of the quadrilateral corners. The quadrilateral for C[i,j] has corners at:

(X[i+1, j], Y[i+1, j])          (X[i+1, j+1], Y[i+1, j+1])
                      +--------+
                      | C[i,j] |
                      +--------+
    (X[i, j], Y[i, j])          (X[i, j+1], Y[i, j+1]),

Note that the column index corresponds to the x-coordinate, and the row index corresponds to y. For details, see the Notes section below.

The dimensions of X and Y should be one greater than those of C. Alternatively, X, Y and C may have equal dimensions, in which case the last row and column of C will be ignored.

If X and/or Y are 1-D arrays or column vectors they will be expanded as needed into the appropriate 2-D arrays, making a rectangular grid.

cmap : str or Colormap, optional

A Colormap instance or registered colormap name. The colormap maps the C values to colors. Defaults to rcParams["image.cmap"].

norm : Normalize, optional

The Normalize instance scales the data values to the canonical colormap range [0, 1] for mapping to colors. By default, the data range is mapped to the colorbar range using linear scaling.

vmin, vmax : scalar, optional, default: None

The colorbar range. If None, suitable min/max values are automatically chosen by the Normalize instance (defaults to the respective min/max values of C in case of the default linear scaling).

edgecolors : {'none', None, 'face', color, color sequence}, optional

The color of the edges. Defaults to 'none'. Possible values:

The singular form edgecolor works as an alias.

alpha : scalar, optional, default: None

The alpha blending value, between 0 (transparent) and 1 (opaque).

shading : {'flat', 'gouraud'}, optional

The fill style, Possible values:

  • 'flat': A solid color is used for each quad. The color of the quad (i, j), (i+1, j), (i, j+1), (i+1, j+1) is given by C[i,j].
  • 'gouraud': Each quad will be Gouraud shaded: The color of the corners (i', j') are given by C[i',j']. The color values of the area in between is interpolated from the corner values. When Gouraud shading is used, edgecolors is ignored.
snap : bool, optional, default: False

Whether to snap the mesh to pixel boundaries.

Returns:
mesh : matplotlib.collections.QuadMesh
Other Parameters:
**kwargs

Additionally, the following arguments are allowed. They are passed along to the QuadMesh constructor:

Property Description
agg_filter a filter function, which takes a (m, n, 3) float array and a dpi value, and returns a (m, n, 3) array
alpha float or None
animated bool
antialiased or aa or antialiaseds bool or sequence of bools
array ndarray
capstyle {'butt', 'round', 'projecting'}
clim a length 2 sequence of floats; may be overridden in methods that have vmin and vmax kwargs.
clip_box Bbox
clip_on bool
clip_path [(Path, Transform) | Patch | None]
cmap colormap or registered colormap name
color color or sequence of rgba tuples
contains callable
edgecolor or ec or edgecolors color or sequence of colors or 'face'
facecolor or facecolors or fc color or sequence of colors
figure Figure
gid str
hatch {'/', '\', '|', '-', '+', 'x', 'o', 'O', '.', '*'}
in_layout bool
joinstyle {'miter', 'round', 'bevel'}
label object
linestyle or dashes or linestyles or ls {'-', '--', '-.', ':', '', (offset, on-off-seq), ...}
linewidth or linewidths or lw float or sequence of floats
norm Normalize
offset_position {'screen', 'data'}
offsets float or sequence of floats
path_effects AbstractPathEffect
picker None or bool or float or callable
pickradius unknown
rasterized bool or None
sketch_params (scale: float, length: float, randomness: float)
snap bool or None
transform Transform
url str
urls List[str] or None
visible bool
zorder float

See also

pcolor
An alternative implementation with slightly different features. For a detailed discussion on the differences see Differences between pcolor() and pcolormesh().
imshow
If X and Y are each equidistant, imshow can be a faster alternative.

Notes

Masked arrays

C may be a masked array. If C[i, j] is masked, the corresponding quadrilateral will be transparent. Masking of X and Y is not supported. Use pcolor if you need this functionality.

Grid orientation

The grid orientation follows the standard matrix convention: An array C with shape (nrows, ncolumns) is plotted with the column number as X and the row number as Y.

Differences between pcolor() and pcolormesh()

Both methods are used to create a pseudocolor plot of a 2-D array using quadrilaterals.

The main difference lies in the created object and internal data handling: While pcolor returns a PolyCollection, pcolormesh returns a QuadMesh. The latter is more specialized for the given purpose and thus is faster. It should almost always be preferred.

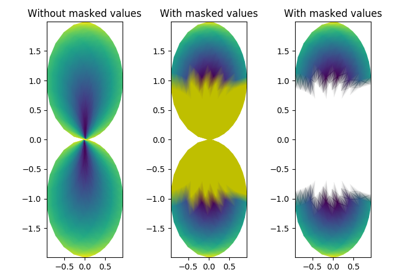
There is also a slight difference in the handling of masked arrays. Both pcolor and pcolormesh support masked arrays for C. However, only pcolor supports masked arrays for X and Y. The reason lies in the internal handling of the masked values. pcolor leaves out the respective polygons from the PolyCollection. pcolormesh sets the facecolor of the masked elements to transparent. You can see the difference when using edgecolors. While all edges are drawn irrespective of masking in a QuadMesh, the edge between two adjacent masked quadrilaterals in pcolor is not drawn as the corresponding polygons do not exist in the PolyCollection.

Another difference is the support of Gouraud shading in pcolormesh, which is not available with pcolor.

Note

In addition to the above described arguments, this function can take a data keyword argument. If such a data argument is given, the following arguments are replaced by data[<arg>]:

  • All positional and all keyword arguments.

Objects passed as data must support item access (data[<arg>]) and membership test (<arg> in data).

Examples using matplotlib.pyplot.pcolormesh