Version 3.0.3
Note
Click here to download the full example code
The axisartist toolkit tutorial.
Warning
axisartist uses a custom Axes class (derived from the mpl's original Axes class). As a side effect, some commands (mostly tick-related) do not work.
The axisartist contains a custom Axes class that is meant to support curvilinear grids (e.g., the world coordinate system in astronomy). Unlike mpl's original Axes class which uses Axes.xaxis and Axes.yaxis to draw ticks, ticklines, etc., axisartist uses a special artist (AxisArtist) that can handle ticks, ticklines, etc. for curved coordinate systems.
Demo Floating Axis
Since it uses special artists, some Matplotlib commands that work on Axes.xaxis and Axes.yaxis may not work.
The axisartist module provides a custom (and very experimental) Axes class, where each axis (left, right, top, and bottom) have a separate associated artist which is responsible for drawing the axis-line, ticks, ticklabels, and labels. You can also create your own axis, which can pass through a fixed position in the axes coordinate, or a fixed position in the data coordinate (i.e., the axis floats around when viewlimit changes).
The axes class, by default, has its xaxis and yaxis invisible, and has 4 additional artists which are responsible for drawing the 4 axis spines in "left", "right", "bottom", and "top". They are accessed as ax.axis["left"], ax.axis["right"], and so on, i.e., ax.axis is a dictionary that contains artists (note that ax.axis is still a callable method and it behaves as an original Axes.axis method in Matplotlib).
To create an axes,
import mpl_toolkits.axisartist as AA
fig = plt.figure(1)
ax = AA.Axes(fig, [0.1, 0.1, 0.8, 0.8])
fig.add_axes(ax)
or to create a subplot
ax = AA.Subplot(fig, 111)
fig.add_subplot(ax)
For example, you can hide the right and top spines using:
ax.axis["right"].set_visible(False)
ax.axis["top"].set_visible(False)
Simple Axisline3
It is also possible to add a horizontal axis. For example, you may have an horizontal axis at y=0 (in data coordinate).
ax.axis["y=0"] = ax.new_floating_axis(nth_coord=0, value=0)
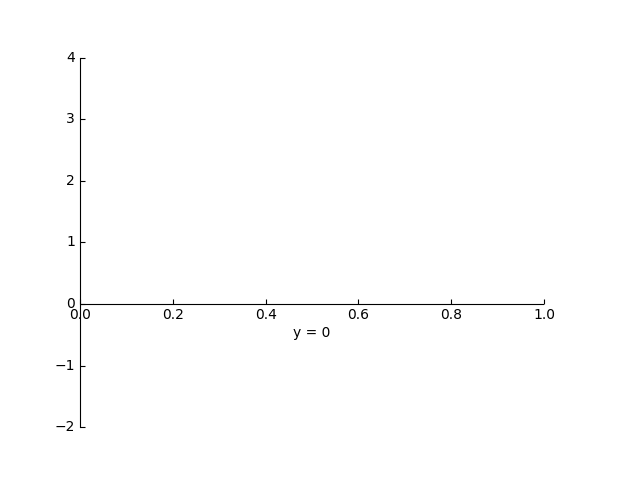
Simple Axisartist1
Or a fixed axis with some offset
# make new (right-side) yaxis, but with some offset
ax.axis["right2"] = ax.new_fixed_axis(loc="right",
              offset=(20, 0))
Most commands in the axes_grid1 toolkit can take an axes_class keyword argument, and the commands create an axes of the given class. For example, to create a host subplot with axisartist.Axes,
import mpl_toolkits.axisartist as AA
from mpl_toolkits.axes_grid1 import host_subplot

host = host_subplot(111, axes_class=AA.Axes)
Here is an example that uses ParasiteAxes.

Demo Parasite Axes2
The motivation behind the AxisArtist module is to support a curvilinear grid and ticks.
Demo Curvelinear Grid
AxisArtist also supports a Floating Axes whose outer axes are defined as floating axis.
Demo Floating Axes
The axisartist namespace includes a derived Axes implementation. The biggest difference is that the artists responsible to draw axis line, ticks, ticklabel and axis labels are separated out from the mpl's Axis class, which are much more than artists in the original mpl. This change was strongly motivated to support curvilinear grid. Here are a few things that mpl_tootlkits.axisartist.Axes is different from original Axes from mpl.
In summary, all these changes was to support
Demo Floating Axis
mpl_toolkits.axisartist.Axes class defines a axis attribute, which is a dictionary of AxisArtist instances. By default, the dictionary has 4 AxisArtist instances, responsible for drawing of left, right, bottom and top axis.
xaxis and yaxis attributes are still available, however they are set to not visible. As separate artists are used for rendering axis, some axis-related method in mpl may have no effect. In addition to AxisArtist instances, the mpl_toolkits.axisartist.Axes will have gridlines attribute (Gridlines), which obviously draws grid lines.
In both AxisArtist and Gridlines, the calculation of tick and grid location is delegated to an instance of GridHelper class. mpl_toolkits.axisartist.Axes class uses GridHelperRectlinear as a grid helper. The GridHelperRectlinear class is a wrapper around the xaxis and yaxis of mpl's original Axes, and it was meant to work as the way how mpl's original axes works. For example, tick location changes using set_ticks method and etc. should work as expected. But change in artist properties (e.g., color) will not work in general, although some effort has been made so that some often-change attributes (color, etc.) are respected.
AxisArtist can be considered as a container artist with following attributes which will draw ticks, labels, etc.
- line
- major_ticks, major_ticklabels
- minor_ticks, minor_ticklabels
- offsetText
- label
Derived from Line2d class. Responsible for drawing a spinal(?) line.
Derived from Line2d class. Note that ticks are markers.
Derived from Text. Note that it is not a list of Text artist, but a single artist (similar to a collection).
Derived from Text.
By default, following for axis artists are defined.:
ax.axis["left"], ax.axis["bottom"], ax.axis["right"], ax.axis["top"]
The ticklabels and axislabel of the top and the right axis are set to not visible.
For example, if you want to change the color attributes of major_ticklabels of the bottom x-axis
ax.axis["bottom"].major_ticklabels.set_color("b")
Similarly, to make ticklabels invisible
ax.axis["bottom"].major_ticklabels.set_visible(False)
AxisAritst provides a helper method to control the visibility of ticks, ticklabels, and label. To make ticklabel invisible,
ax.axis["bottom"].toggle(ticklabels=False)
To make all of ticks, ticklabels, and (axis) label invisible
ax.axis["bottom"].toggle(all=False)
To turn all off but ticks on
ax.axis["bottom"].toggle(all=False, ticks=True)
To turn all on but (axis) label off
ax.axis["bottom"].toggle(all=True, label=False))
ax.axis's __getitem__ method can take multiple axis names. For example, to turn ticklabels of "top" and "right" axis on,
ax.axis["top","right"].toggle(ticklabels=True))
Note that 'ax.axis["top","right"]' returns a simple proxy object that translate above code to something like below.
for n in ["top","right"]:
  ax.axis[n].toggle(ticklabels=True))
So, any return values in the for loop are ignored. And you should not use it anything more than a simple method.
Like the list indexing ":" means all items, i.e.,
ax.axis[:].major_ticks.set_color("r")
changes tick color in all axis.
Same as the original mpl's axes.:
ax.set_xticks([1,2,3])
Change the properties of appropriate artists. For example, to change the color of the ticklabels:
ax.axis["left"].major_ticklabels.set_color("r")
To change the attributes of multiple axis:
ax.axis["left","bottom"].major_ticklabels.set_color("r")
or to change the attributes of all axis:
ax.axis[:].major_ticklabels.set_color("r")
axis.major_ticks.set_ticksize method. To change the direction of the ticks (ticks are in opposite direction of ticklabels by default), use axis.major_ticks.set_tick_out method.
To change the pad between ticks and ticklabels, use axis.major_ticklabels.set_pad method.
To change the pad between ticklabels and axis label, axis.label.set_pad method.
This is also quite different from the original mpl and can be confusing. When you want to rotate the ticklabels, first consider using "set_axis_direction" method.
ax1.axis["left"].major_ticklabels.set_axis_direction("top")
ax1.axis["right"].label.set_axis_direction("left")
Simple Axis Direction01
The parameter for set_axis_direction is one of ["left", "right", "bottom", "top"].
You must understand some underlying concept of directions.
There is a reference direction which is defined as the direction of the axis line with increasing coordinate. For example, the reference direction of the left x-axis is from bottom to top.
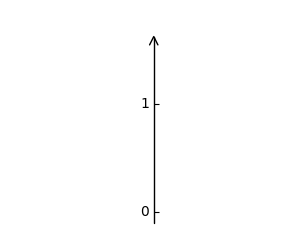
Axis Direction Demo - Step 01
The direction, text angle, and alignments of the ticks, ticklabels and axis-label is determined with respect to the reference direction
ticklabel_direction is either the right-hand side (+) of the reference direction or the left-hand side (-).
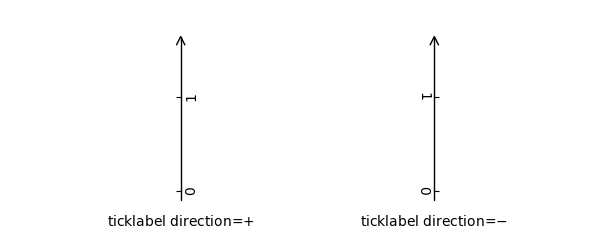
Axis Direction Demo - Step 02
same for the label_direction
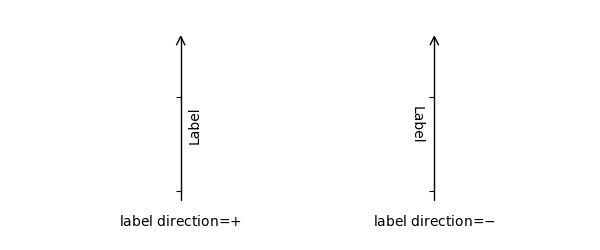
Axis Direction Demo - Step 03
ticks are by default drawn toward the opposite direction of the ticklabels.
text rotation of ticklabels and label is determined in reference to the ticklabel_direction or label_direction, respectively. The rotation of ticklabels and label is anchored.
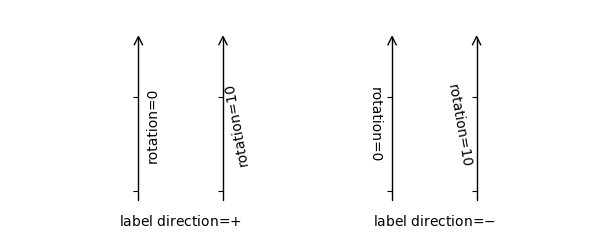
Axis Direction Demo - Step 04
On the other hand, there is a concept of "axis_direction". This is a default setting of above properties for each, "bottom", "left", "top", and "right" axis.
? ? left bottom right top axislabel direction '-' '+' '+' '-' axislabel rotation 180 0 0 180 axislabel va center top center bottom axislabel ha right center right center ticklabel direction '-' '+' '+' '-' ticklabels rotation 90 0 -90 180 ticklabel ha right center right center ticklabel va center baseline center baseline
And, 'set_axis_direction("top")' means to adjust the text rotation etc, for settings suitable for "top" axis. The concept of axis direction can be more clear with curved axis.
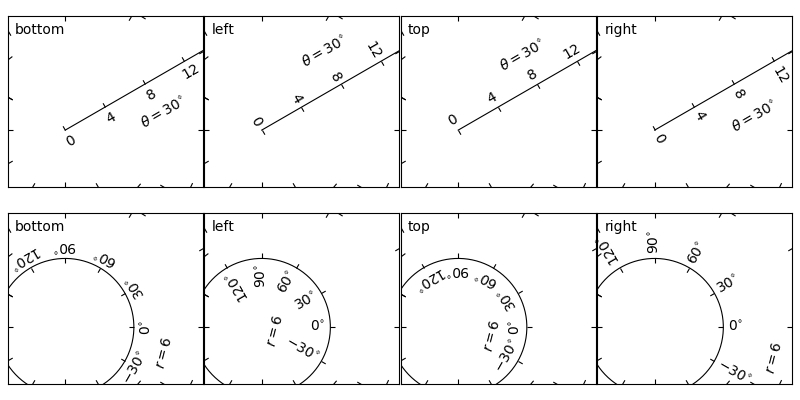
Demo Axis Direction
The axis_direction can be adjusted in the AxisArtist level, or in the level of its child arists, i.e., ticks, ticklabels, and axis-label.
ax1.axis["left"].set_axis_direction("top")
changes axis_direction of all the associated artist with the "left" axis, while
ax1.axis["left"].major_ticklabels.set_axis_direction("top")
changes the axis_direction of only the major_ticklabels. Note that set_axis_direction in the AxisArtist level changes the ticklabel_direction and label_direction, while changing the axis_direction of ticks, ticklabels, and axis-label does not affect them.
If you want to make ticks outward and ticklabels inside the axes, use invert_ticklabel_direction method.
ax.axis[:].invert_ticklabel_direction()
A related method is "set_tick_out". It makes ticks outward (as a matter of fact, it makes ticks toward the opposite direction of the default direction).
ax.axis[:].major_ticks.set_tick_out(True)
Simple Axis Direction03
So, in summary,
- AxisArtist's methods
- set_axis_direction : "left", "right", "bottom", or "top"
- set_ticklabel_direction : "+" or "-"
- set_axislabel_direction : "+" or "-"
- invert_ticklabel_direction
- Ticks' methods (major_ticks and minor_ticks)
- set_tick_out : True or False
- set_ticksize : size in points
- TickLabels' methods (major_ticklabels and minor_ticklabels)
- set_axis_direction : "left", "right", "bottom", or "top"
- set_rotation : angle with respect to the reference direction
- set_ha and set_va : see below
- AxisLabels' methods (label)
- set_axis_direction : "left", "right", "bottom", or "top"
- set_rotation : angle with respect to the reference direction
- set_ha and set_va
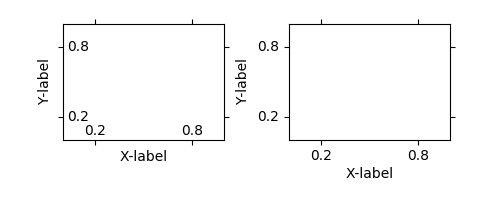
Alignment of TickLabels are treated specially. See below
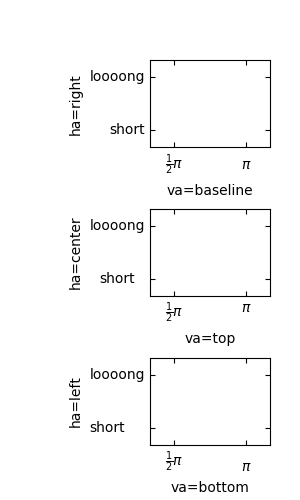
Demo Ticklabel Alignment
To change the pad between ticks and ticklabels
ax.axis["left"].major_ticklabels.set_pad(10)
Or ticklabels and axis-label
ax.axis["left"].label.set_pad(10)
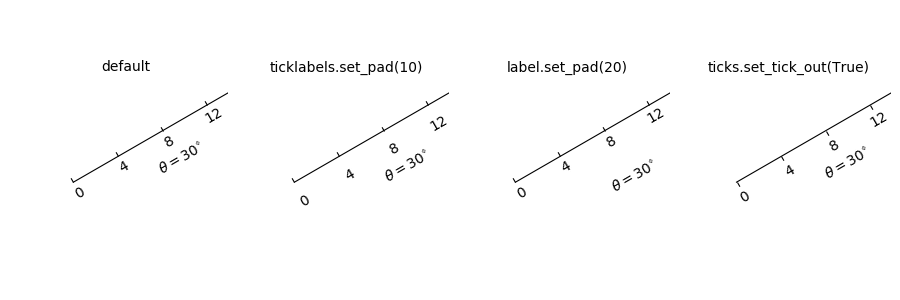
Simple Axis Pad
To actually define a curvilinear coordinate, you have to use your own grid helper. A generalised version of grid helper class is supplied and this class should suffice in most of cases. A user may provide two functions which defines a transformation (and its inverse pair) from the curved coordinate to (rectilinear) image coordinate. Note that while ticks and grids are drawn for curved coordinate, the data transform of the axes itself (ax.transData) is still rectilinear (image) coordinate.
from mpl_toolkits.axisartist.grid_helper_curvelinear \
     import GridHelperCurveLinear
from mpl_toolkits.axisartist import Subplot

# from curved coordinate to rectlinear coordinate.
def tr(x, y):
    x, y = np.asarray(x), np.asarray(y)
    return x, y-x

# from rectlinear coordinate to curved coordinate.
def inv_tr(x,y):
    x, y = np.asarray(x), np.asarray(y)
    return x, y+x

grid_helper = GridHelperCurveLinear((tr, inv_tr))

ax1 = Subplot(fig, 1, 1, 1, grid_helper=grid_helper)

fig.add_subplot(ax1)
You may use matplotlib's Transform instance instead (but a inverse transformation must be defined). Often, coordinate range in a curved coordinate system may have a limited range, or may have cycles. In those cases, a more customized version of grid helper is required.
import mpl_toolkits.axisartist.angle_helper as angle_helper

# PolarAxes.PolarTransform takes radian. However, we want our coordinate
# system in degree
tr = Affine2D().scale(np.pi/180., 1.) + PolarAxes.PolarTransform()

# extreme finder :  find a range of coordinate.
# 20, 20 : number of sampling points along x, y direction
# The first coordinate (longitude, but theta in polar)
#   has a cycle of 360 degree.
# The second coordinate (latitude, but radius in polar)  has a minimum of 0
extreme_finder = angle_helper.ExtremeFinderCycle(20, 20,
                                                 lon_cycle = 360,
                                                 lat_cycle = None,
                                                 lon_minmax = None,
                                                 lat_minmax = (0, np.inf),
                                                 )

# Find a grid values appropriate for the coordinate (degree,
# minute, second). The argument is a approximate number of grids.
grid_locator1 = angle_helper.LocatorDMS(12)

# And also uses an appropriate formatter.  Note that,the
# acceptable Locator and Formatter class is a bit different than
# that of mpl's, and you cannot directly use mpl's Locator and
# Formatter here (but may be possible in the future).
tick_formatter1 = angle_helper.FormatterDMS()

grid_helper = GridHelperCurveLinear(tr,
                                    extreme_finder=extreme_finder,
                                    grid_locator1=grid_locator1,
                                    tick_formatter1=tick_formatter1
                                    )
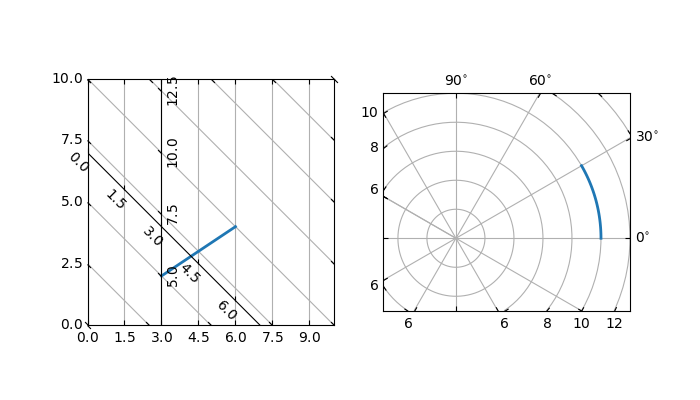
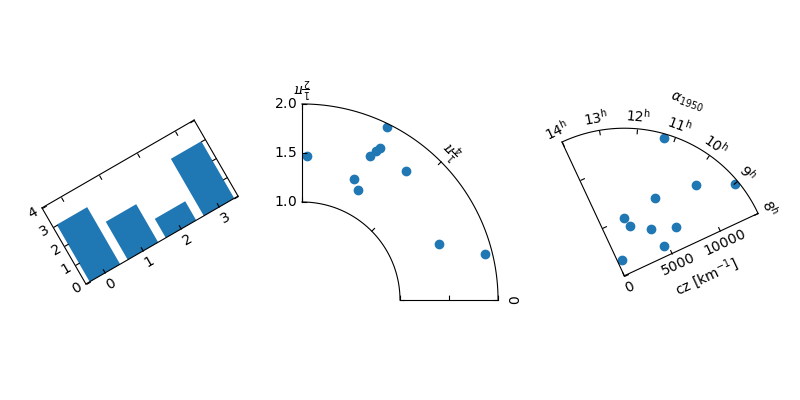
Again, the transData of the axes is still a rectilinear coordinate (image coordinate). You may manually do conversion between two coordinates, or you may use Parasite Axes for convenience.:
ax1 = SubplotHost(fig, 1, 2, 2, grid_helper=grid_helper)

# A parasite axes with given transform
ax2 = ParasiteAxesAuxTrans(ax1, tr, "equal")
# note that ax2.transData == tr + ax1.transData
# Anthing you draw in ax2 will match the ticks and grids of ax1.
ax1.parasites.append(ax2)
Demo Curvelinear Grid
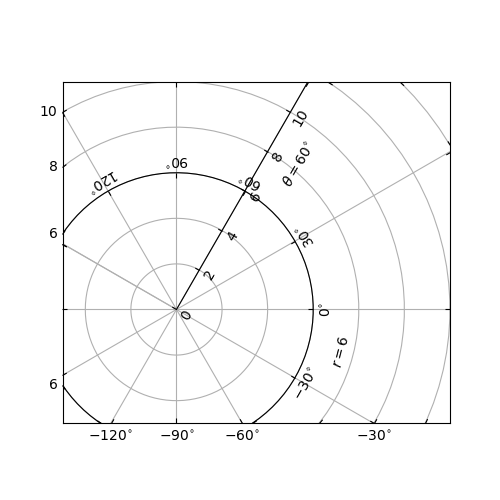
A floating axis is an axis one of whose data coordinate is fixed, i.e, its location is not fixed in Axes coordinate but changes as axes data limits changes. A floating axis can be created using new_floating_axis method. However, it is your responsibility that the resulting AxisArtist is properly added to the axes. A recommended way is to add it as an item of Axes's axis attribute.:
# floating axis whose first (index starts from 0) coordinate
# (theta) is fixed at 60

ax1.axis["lat"] = axis = ax1.new_floating_axis(0, 60)
axis.label.set_text(r"$\theta = 60^{\circ}$")
axis.label.set_visible(True)
See the first example of this page.
The code need more refinement. Here is a incomplete list of issues and TODO's
Keywords: matplotlib code example, codex, python plot, pyplot Gallery generated by Sphinx-Gallery