Version 3.0.3
Note
Click here to download the full example code
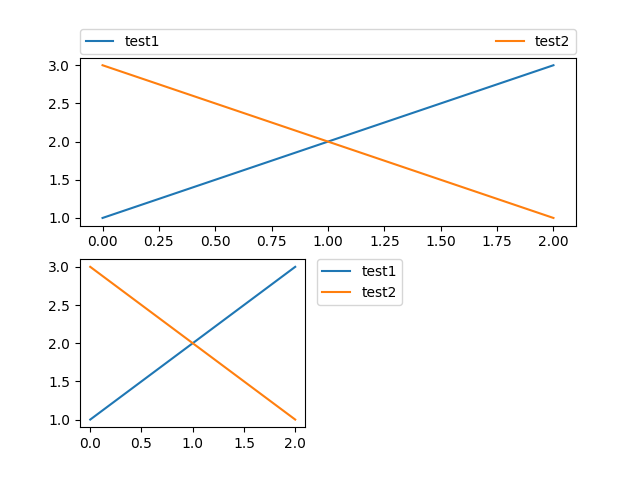
import matplotlib.pyplot as plt


plt.subplot(211)
plt.plot([1, 2, 3], label="test1")
plt.plot([3, 2, 1], label="test2")
# Place a legend above this subplot, expanding itself to
# fully use the given bounding box.
plt.legend(bbox_to_anchor=(0., 1.02, 1., .102), loc='lower left',
           ncol=2, mode="expand", borderaxespad=0.)

plt.subplot(223)
plt.plot([1, 2, 3], label="test1")
plt.plot([3, 2, 1], label="test2")
# Place a legend to the right of this smaller subplot.
plt.legend(bbox_to_anchor=(1.05, 1), loc='upper left', borderaxespad=0.)

plt.show()
Keywords: matplotlib code example, codex, python plot, pyplot Gallery generated by Sphinx-Gallery