Version 3.0.3
Note
Click here to download the full example code
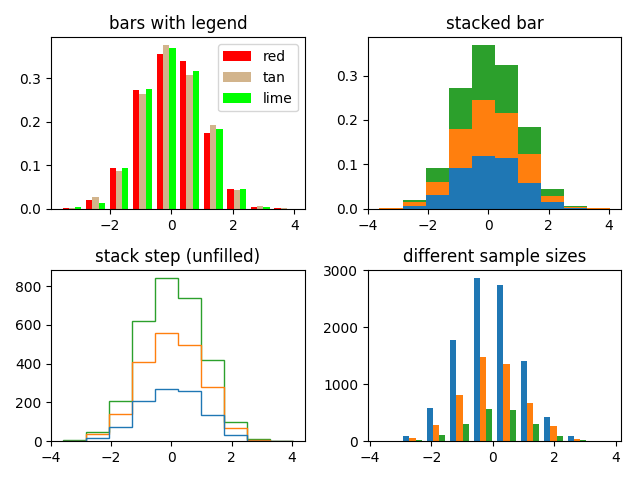
Plot histogram with multiple sample sets and demonstrate:
- Use of legend with multiple sample sets
- Stacked bars
- Step curve with no fill
- Data sets of different sample sizes
Selecting different bin counts and sizes can significantly affect the shape of a histogram. The Astropy docs have a great section on how to select these parameters: http://docs.astropy.org/en/stable/visualization/histogram.html
import numpy as np
import matplotlib.pyplot as plt

np.random.seed(19680801)

n_bins = 10
x = np.random.randn(1000, 3)

fig, axes = plt.subplots(nrows=2, ncols=2)
ax0, ax1, ax2, ax3 = axes.flatten()

colors = ['red', 'tan', 'lime']
ax0.hist(x, n_bins, density=True, histtype='bar', color=colors, label=colors)
ax0.legend(prop={'size': 10})
ax0.set_title('bars with legend')

ax1.hist(x, n_bins, density=True, histtype='bar', stacked=True)
ax1.set_title('stacked bar')

ax2.hist(x, n_bins, histtype='step', stacked=True, fill=False)
ax2.set_title('stack step (unfilled)')

# Make a multiple-histogram of data-sets with different length.
x_multi = [np.random.randn(n) for n in [10000, 5000, 2000]]
ax3.hist(x_multi, n_bins, histtype='bar')
ax3.set_title('different sample sizes')

fig.tight_layout()
plt.show()
Keywords: matplotlib code example, codex, python plot, pyplot Gallery generated by Sphinx-Gallery