Version 3.0.3
Note
Click here to download the full example code
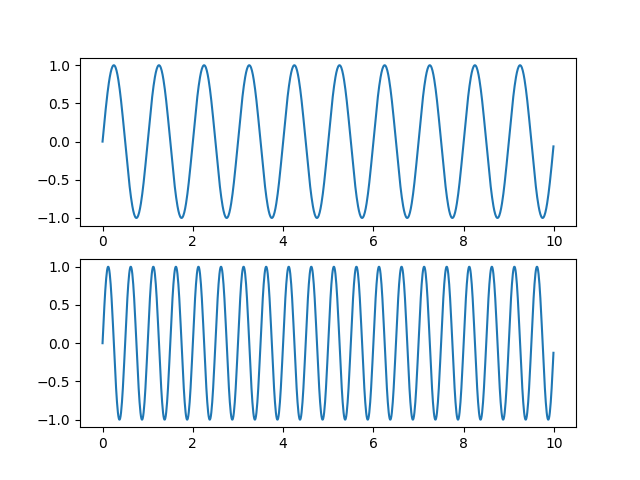
It's common to make two or more plots which share an axis, e.g., two
subplots with time as a common axis. When you pan and zoom around on
one, you want the other to move around with you. To facilitate this,
matplotlib Axes support a sharex and sharey attribute. When
you create a subplot() or
axes() instance, you can pass in a keyword
indicating what axes you want to share with
import numpy as np
import matplotlib.pyplot as plt

t = np.arange(0, 10, 0.01)

ax1 = plt.subplot(211)
ax1.plot(t, np.sin(2*np.pi*t))

ax2 = plt.subplot(212, sharex=ax1)
ax2.plot(t, np.sin(4*np.pi*t))

plt.show()
Keywords: matplotlib code example, codex, python plot, pyplot Gallery generated by Sphinx-Gallery