Version 3.0.3
Note
Click here to download the full example code
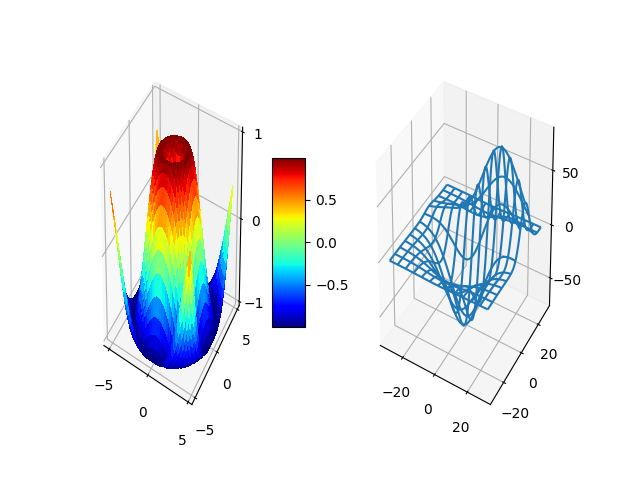
Create two three-dimensional plots in the same figure.
# This import registers the 3D projection, but is otherwise unused.
from mpl_toolkits.mplot3d import Axes3D  # noqa: F401 unused import

from matplotlib import cm
#from matplotlib.ticker import LinearLocator, FixedLocator, FormatStrFormatter
import matplotlib.pyplot as plt
import numpy as np

fig = plt.figure()

ax = fig.add_subplot(1, 2, 1, projection='3d')
X = np.arange(-5, 5, 0.25)
Y = np.arange(-5, 5, 0.25)
X, Y = np.meshgrid(X, Y)
R = np.sqrt(X**2 + Y**2)
Z = np.sin(R)
surf = ax.plot_surface(X, Y, Z, rstride=1, cstride=1, cmap=cm.jet,
        linewidth=0, antialiased=False)
ax.set_zlim3d(-1.01, 1.01)

#ax.w_zaxis.set_major_locator(LinearLocator(10))
#ax.w_zaxis.set_major_formatter(FormatStrFormatter('%.03f'))

fig.colorbar(surf, shrink=0.5, aspect=5)

from mpl_toolkits.mplot3d.axes3d import get_test_data
ax = fig.add_subplot(1, 2, 2, projection='3d')
X, Y, Z = get_test_data(0.05)
ax.plot_wireframe(X, Y, Z, rstride=10, cstride=10)

plt.show()
The use of the following functions, methods, classes and modules is shown in this example:
import matplotlib
import mpl_toolkits
matplotlib.figure.Figure.add_subplot
mpl_toolkits.mplot3d.axes3d.Axes3D.plot_surface
mpl_toolkits.mplot3d.axes3d.Axes3D.plot_wireframe
mpl_toolkits.mplot3d.axes3d.Axes3D.set_zlim3d
Keywords: matplotlib code example, codex, python plot, pyplot Gallery generated by Sphinx-Gallery