Version 3.0.3
Note
Click here to download the full example code
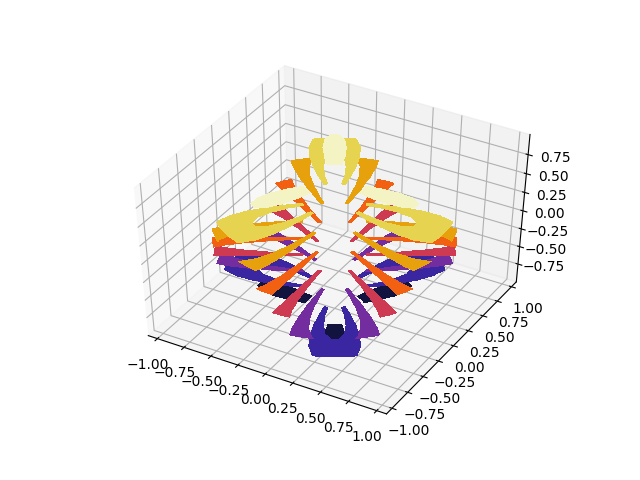
Filled contour plots of unstructured triangular grids.
The data used is the same as in the second plot of trisurf3d_demo2. tricontour3d_demo shows the unfilled version of this example.
# This import registers the 3D projection, but is otherwise unused.
from mpl_toolkits.mplot3d import Axes3D  # noqa: F401 unused import

import matplotlib.pyplot as plt
import matplotlib.tri as tri
import numpy as np

# First create the x, y, z coordinates of the points.
n_angles = 48
n_radii = 8
min_radius = 0.25

# Create the mesh in polar coordinates and compute x, y, z.
radii = np.linspace(min_radius, 0.95, n_radii)
angles = np.linspace(0, 2*np.pi, n_angles, endpoint=False)
angles = np.repeat(angles[..., np.newaxis], n_radii, axis=1)
angles[:, 1::2] += np.pi/n_angles

x = (radii*np.cos(angles)).flatten()
y = (radii*np.sin(angles)).flatten()
z = (np.cos(radii)*np.cos(3*angles)).flatten()

# Create a custom triangulation.
triang = tri.Triangulation(x, y)

# Mask off unwanted triangles.
triang.set_mask(np.hypot(x[triang.triangles].mean(axis=1),
                         y[triang.triangles].mean(axis=1))
                < min_radius)

fig = plt.figure()
ax = fig.gca(projection='3d')
ax.tricontourf(triang, z, cmap=plt.cm.CMRmap)

# Customize the view angle so it's easier to understand the plot.
ax.view_init(elev=45.)

plt.show()
Keywords: matplotlib code example, codex, python plot, pyplot Gallery generated by Sphinx-Gallery