Version 3.0.3
Note
Click here to download the full example code
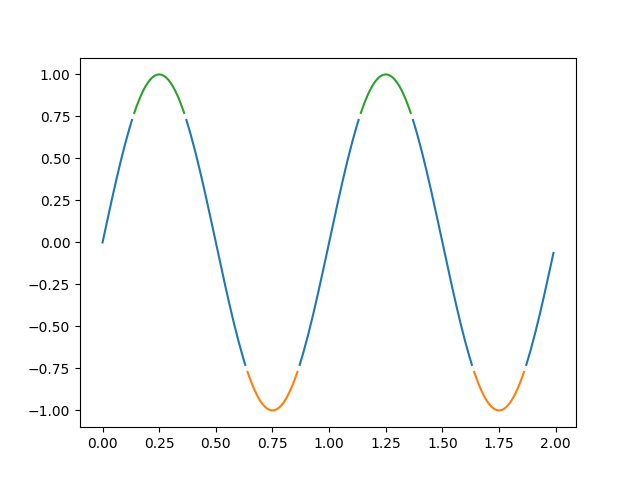
Use masked arrays to plot a line with different colors by y-value.
import numpy as np
import matplotlib.pyplot as plt

t = np.arange(0.0, 2.0, 0.01)
s = np.sin(2 * np.pi * t)

upper = 0.77
lower = -0.77


supper = np.ma.masked_where(s < upper, s)
slower = np.ma.masked_where(s > lower, s)
smiddle = np.ma.masked_where(np.logical_or(s < lower, s > upper), s)

fig, ax = plt.subplots()
ax.plot(t, smiddle, t, slower, t, supper)
plt.show()
The use of the following functions, methods, classes and modules is shown in this example:
import matplotlib
matplotlib.axes.Axes.plot
matplotlib.pyplot.plot
Keywords: matplotlib code example, codex, python plot, pyplot Gallery generated by Sphinx-Gallery