You are reading an old version of the documentation (v3.0.3). For the latest version see https://matplotlib.org/stable/api/_as_gen/matplotlib.pyplot.plot_date.html
Version 3.0.3
matplotlib
Fork me on GitHub

Table of Contents

matplotlib.pyplot.plot_date

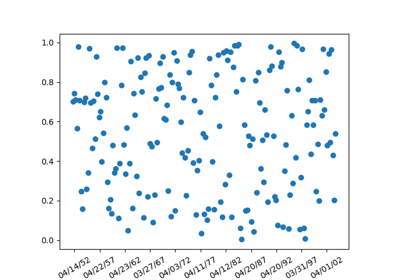
matplotlib.pyplot.plot_date(x, y, fmt='o', tz=None, xdate=True, ydate=False, *, data=None, **kwargs)[source]

Plot data that contains dates.

Similar to plot, this plots y vs. x as lines or markers. However, the axis labels are formatted as dates depending on xdate and ydate.

Parameters:
x, y : array-like

The coordinates of the data points. If xdate or ydate is True, the respective values x or y are interpreted as Matplotlib dates.

fmt : str, optional

The plot format string. For details, see the corresponding parameter in plot.

tz : [ None | timezone string | tzinfo instance]

The time zone to use in labeling dates. If None, defaults to rcParam timezone.

xdate : bool, optional, default: True

If True, the x-axis will be interpreted as Matplotlib dates.

ydate : bool, optional, default: False

If True, the y-axis will be interpreted as Matplotlib dates.

Returns:
lines

A list of Line2D objects representing the plotted data.

Other Parameters:
**kwargs

Keyword arguments control the Line2D properties:

Property Description
agg_filter a filter function, which takes a (m, n, 3) float array and a dpi value, and returns a (m, n, 3) array
alpha float
animated bool
antialiased bool
clip_box Bbox
clip_on bool
clip_path [(Path, Transform) | Patch | None]
color color
contains callable
dash_capstyle {'butt', 'round', 'projecting'}
dash_joinstyle {'miter', 'round', 'bevel'}
dashes sequence of floats (on/off ink in points) or (None, None)
drawstyle {'default', 'steps', 'steps-pre', 'steps-mid', 'steps-post'}
figure Figure
fillstyle {'full', 'left', 'right', 'bottom', 'top', 'none'}
gid str
in_layout bool
label object
linestyle {'-', '--', '-.', ':', '', (offset, on-off-seq), ...}
linewidth float
marker unknown
markeredgecolor color
markeredgewidth float
markerfacecolor color
markerfacecoloralt color
markersize float
markevery unknown
path_effects AbstractPathEffect
picker float or callable[[Artist, Event], Tuple[bool, dict]]
pickradius float
rasterized bool or None
sketch_params (scale: float, length: float, randomness: float)
snap bool or None
solid_capstyle {'butt', 'round', 'projecting'}
solid_joinstyle {'miter', 'round', 'bevel'}
transform matplotlib.transforms.Transform
url str
visible bool
xdata 1D array
ydata 1D array
zorder float

See also

matplotlib.dates
Helper functions on dates.
matplotlib.dates.date2num
Convert dates to num.
matplotlib.dates.num2date
Convert num to dates.
matplotlib.dates.drange
Create an equally spaced sequence of dates.

Notes

If you are using custom date tickers and formatters, it may be necessary to set the formatters/locators after the call to plot_date. plot_date will set the default tick locator to AutoDateLocator (if the tick locator is not already set to a DateLocator instance) and the default tick formatter to AutoDateFormatter (if the tick formatter is not already set to a DateFormatter instance).

Note

In addition to the above described arguments, this function can take a data keyword argument. If such a data argument is given, the following arguments are replaced by data[<arg>]:

  • All arguments with the following names: 'x', 'y'.

Objects passed as data must support item access (data[<arg>]) and membership test (<arg> in data).

Examples using matplotlib.pyplot.plot_date