| Parameters: |
- X : array-like or PIL image
The image data. Supported array shapes are:
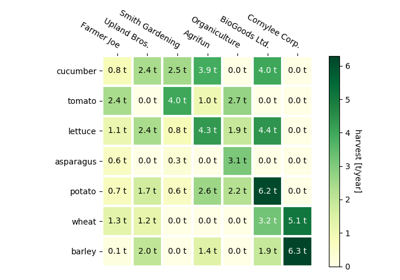
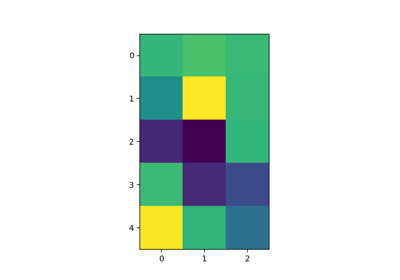
- (M, N): an image with scalar data. The data is visualized
using a colormap.
- (M, N, 3): an image with RGB values (float or uint8).
- (M, N, 4): an image with RGBA values (float or uint8), i.e.
including transparency.
The first two dimensions (M, N) define the rows and columns of
the image.
The RGB(A) values should be in the range [0 .. 1] for floats or
[0 .. 255] for integers. Out-of-range values will be clipped to
these bounds.
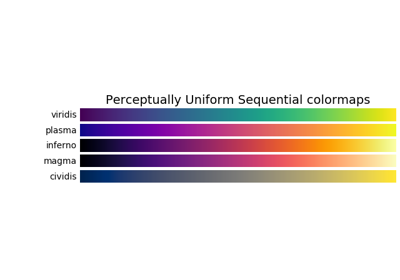
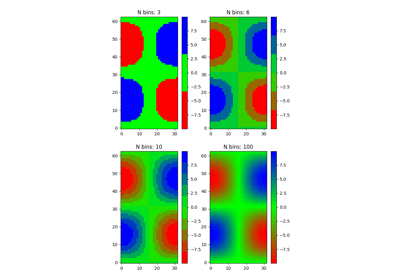
- cmap : str or
Colormap, optional
A Colormap instance or registered colormap name. The colormap
maps scalar data to colors. It is ignored for RGB(A) data.
Defaults to rcParams["image.cmap"].
- aspect : {'equal', 'auto'} or float, optional
Controls the aspect ratio of the axes. The aspect is of particular
relevance for images since it may distort the image, i.e. pixel
will not be square.
This parameter is a shortcut for explicitly calling
Axes.set_aspect. See there for further details.
- 'equal': Ensures an aspect ratio of 1. Pixels will be square
(unless pixel sizes are explicitly made non-square in data
coordinates using extent).
- 'auto': The axes is kept fixed and the aspect is adjusted so
that the data fit in the axes. In general, this will result in
non-square pixels.
If not given, use rcParams["image.aspect"] (default: 'equal').
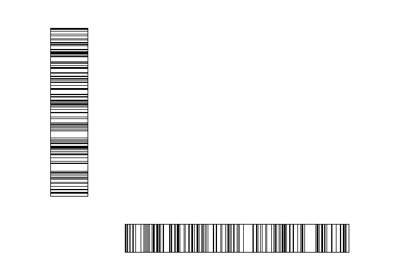
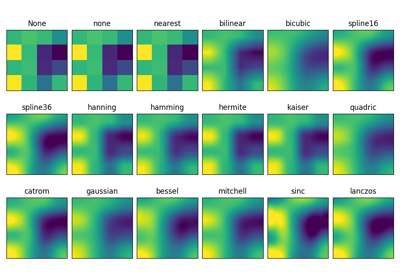
- interpolation : str, optional
The interpolation method used. If None
rcParams["image.interpolation"] is used, which defaults to 'nearest'.
Supported values are 'none', 'nearest', 'bilinear', 'bicubic',
'spline16', 'spline36', 'hanning', 'hamming', 'hermite', 'kaiser',
'quadric', 'catrom', 'gaussian', 'bessel', 'mitchell', 'sinc',
'lanczos'.
If interpolation is 'none', then no interpolation is performed
on the Agg, ps and pdf backends. Other backends will fall back to
'nearest'.
See
Interpolations for imshow/matshow
for an overview of the supported interpolation methods.
Some interpolation methods require an additional radius parameter,
which can be set by filterrad. Additionally, the antigrain image
resize filter is controlled by the parameter filternorm.
- norm :
Normalize, optional
If scalar data are used, the Normalize instance scales the
data values to the canonical colormap range [0,1] for mapping
to colors. By default, the data range is mapped to the
colorbar range using linear scaling. This parameter is ignored for
RGB(A) data.
- vmin, vmax : scalar, optional
When using scalar data and no explicit norm, vmin and vmax
define the data range that the colormap covers. By default,
the colormap covers the complete value range of the supplied
data. vmin, vmax are ignored if the norm parameter is used.
- alpha : scalar, optional
The alpha blending value, between 0 (transparent) and 1 (opaque).
This parameter is ignored for RGBA input data.
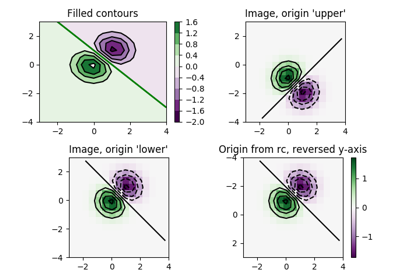
- origin : {'upper', 'lower'}, optional
Place the [0,0] index of the array in the upper left or lower left
corner of the axes. The convention 'upper' is typically used for
matrices and images.
If not given, rcParams["image.origin"] is used, defaulting to 'upper'.
Note that the vertical axes points upward for 'lower'
but downward for 'upper'.
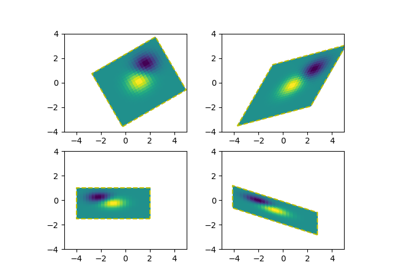
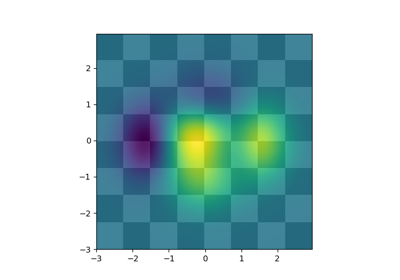
- extent : scalars (left, right, bottom, top), optional
The bounding box in data coordinates that the image will fill.
The image is stretched individually along x and y to fill the box.
The default extent is determined by the following conditions.
Pixels have unit size in data coordinates. Their centers are on
integer coordinates, and their center coordinates range from 0 to
columns-1 horizontally and from 0 to rows-1 vertically.
Note that the direction of the vertical axis and thus the default
values for top and bottom depend on origin:
- For
origin == 'upper' the default is
(-0.5, numcols-0.5, numrows-0.5, -0.5).
- For
origin == 'lower' the default is
(-0.5, numcols-0.5, -0.5, numrows-0.5).
See the example origin and extent in imshow for a
more detailed description.
- shape : scalars (columns, rows), optional, default: None
For raw buffer images.
- filternorm : bool, optional, default: True
A parameter for the antigrain image resize filter (see the
antigrain documentation). If filternorm is set, the filter
normalizes integer values and corrects the rounding errors. It
doesn't do anything with the source floating point values, it
corrects only integers according to the rule of 1.0 which means
that any sum of pixel weights must be equal to 1.0. So, the
filter function must produce a graph of the proper shape.
- filterrad : float > 0, optional, default: 4.0
The filter radius for filters that have a radius parameter, i.e.
when interpolation is one of: 'sinc', 'lanczos' or 'blackman'.
- resample : bool, optional
When True, use a full resampling method. When False, only
resample when the output image is larger than the input image.
- url : str, optional
Set the url of the created AxesImage. See Artist.set_url.
|
|---|