Version 3.0.2
Note
Click here to download the full example code
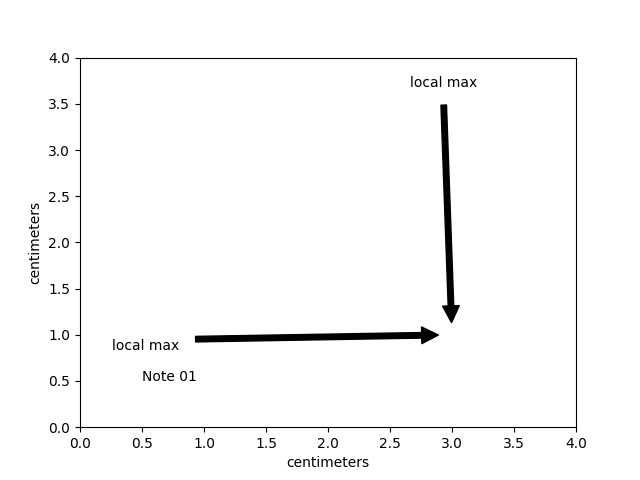
The example illustrates how to create text and arrow annotations using a centimeter-scale plot.
This example requires basic_units.py
import matplotlib.pyplot as plt
from basic_units import cm

fig, ax = plt.subplots()

ax.annotate("Note 01", [0.5*cm, 0.5*cm])

# xy and text both unitized
ax.annotate('local max', xy=(3*cm, 1*cm), xycoords='data',
            xytext=(0.8*cm, 0.95*cm), textcoords='data',
            arrowprops=dict(facecolor='black', shrink=0.05),
            horizontalalignment='right', verticalalignment='top')

# mixing units w/ nonunits
ax.annotate('local max', xy=(3*cm, 1*cm), xycoords='data',
            xytext=(0.8, 0.95), textcoords='axes fraction',
            arrowprops=dict(facecolor='black', shrink=0.05),
            horizontalalignment='right', verticalalignment='top')


ax.set_xlim(0*cm, 4*cm)
ax.set_ylim(0*cm, 4*cm)
plt.show()
Keywords: matplotlib code example, codex, python plot, pyplot Gallery generated by Sphinx-Gallery