Version 3.0.2
Note
Click here to download the full example code
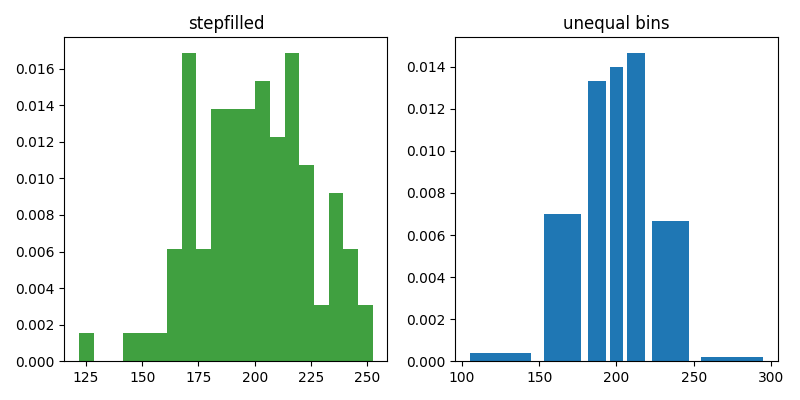
histtype settings¶Selecting different bin counts and sizes can significantly affect the shape of a histogram. The Astropy docs have a great section on how to select these parameters: http://docs.astropy.org/en/stable/visualization/histogram.html
import numpy as np
import matplotlib.pyplot as plt

np.random.seed(19680801)

mu = 200
sigma = 25
x = np.random.normal(mu, sigma, size=100)

fig, (ax0, ax1) = plt.subplots(ncols=2, figsize=(8, 4))

ax0.hist(x, 20, density=True, histtype='stepfilled', facecolor='g', alpha=0.75)
ax0.set_title('stepfilled')

# Create a histogram by providing the bin edges (unequally spaced).
bins = [100, 150, 180, 195, 205, 220, 250, 300]
ax1.hist(x, bins, density=True, histtype='bar', rwidth=0.8)
ax1.set_title('unequal bins')

fig.tight_layout()
plt.show()
Keywords: matplotlib code example, codex, python plot, pyplot Gallery generated by Sphinx-Gallery