Version 3.0.2
Note
Click here to download the full example code
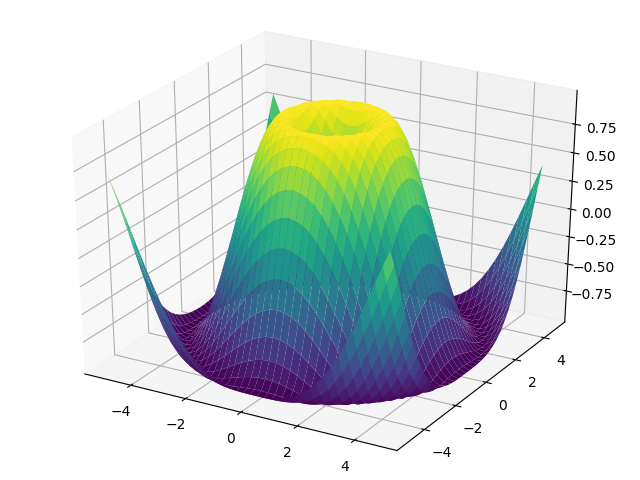
Create a 3D surface plot.
import numpy as np
import matplotlib.pyplot as plt
from matplotlib import cm
from mpl_toolkits.mplot3d import Axes3D

X = np.arange(-5, 5, 0.25)
Y = np.arange(-5, 5, 0.25)
X, Y = np.meshgrid(X, Y)
R = np.sqrt(X**2 + Y**2)
Z = np.sin(R)

fig = plt.figure()
ax = Axes3D(fig)
ax.plot_surface(X, Y, Z, rstride=1, cstride=1, cmap=cm.viridis)

plt.show()
The use of the following functions, methods, classes and modules is shown in this example:
import mpl_toolkits
mpl_toolkits.mplot3d.Axes3D
mpl_toolkits.mplot3d.Axes3D.plot_surface
Keywords: matplotlib code example, codex, python plot, pyplot Gallery generated by Sphinx-Gallery