Version 3.0.2
Note
Click here to download the full example code
import matplotlib.pyplot as plt
import numpy as np
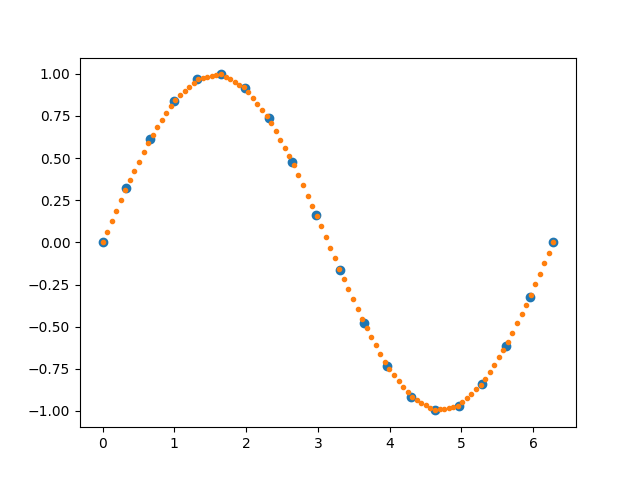
x = np.linspace(0, 2 * np.pi, 20)
y = np.sin(x)
yp = None
xi = np.linspace(x[0], x[-1], 100)
yi = np.interp(xi, x, y, yp)
fig, ax = plt.subplots()
ax.plot(x, y, 'o', xi, yi, '.')
plt.show()
Keywords: matplotlib code example, codex, python plot, pyplot Gallery generated by Sphinx-Gallery