Version 3.0.2
Note
Click here to download the full example code
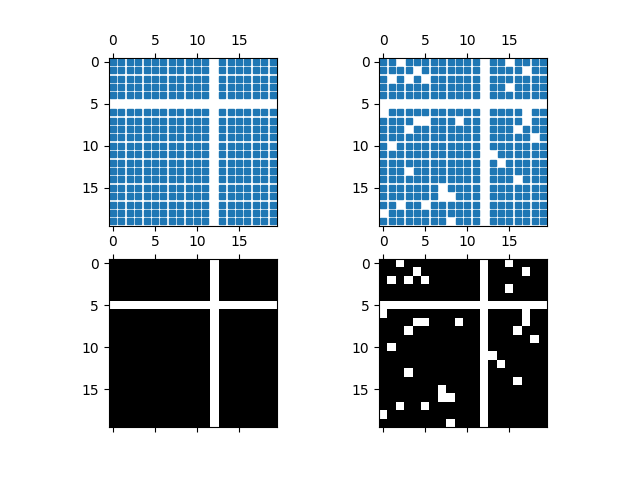
Plot the sparsity pattern of arrays.
import matplotlib.pyplot as plt
import numpy as np

fig, axs = plt.subplots(2, 2)
ax1 = axs[0, 0]
ax2 = axs[0, 1]
ax3 = axs[1, 0]
ax4 = axs[1, 1]

x = np.random.randn(20, 20)
x[5, :] = 0.
x[:, 12] = 0.

ax1.spy(x, markersize=5)
ax2.spy(x, precision=0.1, markersize=5)

ax3.spy(x)
ax4.spy(x, precision=0.1)

plt.show()
The use of the following functions, methods and classes is shown in this example:
import matplotlib
matplotlib.axes.Axes.spy
matplotlib.pyplot.spy
Keywords: matplotlib code example, codex, python plot, pyplot Gallery generated by Sphinx-Gallery