Version 3.0.2
Note
Click here to download the full example code
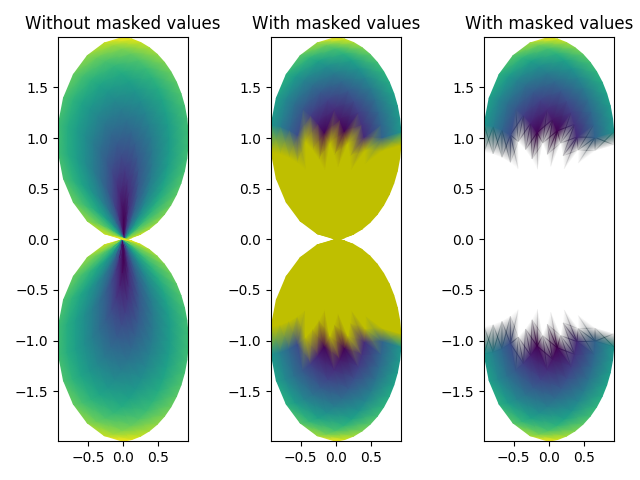
pcolormesh uses a QuadMesh,
a faster generalization of pcolor, but with some restrictions.
This demo illustrates a bug in quadmesh with masked data.
import copy

from matplotlib import cm, pyplot as plt
import numpy as np

n = 12
x = np.linspace(-1.5, 1.5, n)
y = np.linspace(-1.5, 1.5, n * 2)
X, Y = np.meshgrid(x, y)
Qx = np.cos(Y) - np.cos(X)
Qz = np.sin(Y) + np.sin(X)
Z = np.sqrt(X**2 + Y**2) / 5
Z = (Z - Z.min()) / (Z.max() - Z.min())

# The color array can include masked values.
Zm = np.ma.masked_where(np.abs(Qz) < 0.5 * np.max(Qz), Z)

fig, axs = plt.subplots(nrows=1, ncols=3)
axs[0].pcolormesh(Qx, Qz, Z, shading='gouraud')
axs[0].set_title('Without masked values')

# You can control the color of the masked region. We copy the default colormap
# before modifying it.
cmap = copy.copy(cm.get_cmap(plt.rcParams['image.cmap']))
cmap.set_bad('y', 1.0)
axs[1].pcolormesh(Qx, Qz, Zm, shading='gouraud', cmap=cmap)
axs[1].set_title('With masked values')

# Or use the default, which is transparent.
axs[2].pcolormesh(Qx, Qz, Zm, shading='gouraud')
axs[2].set_title('With masked values')

fig.tight_layout()
plt.show()
The use of the following functions and methods is shown in this example:
import matplotlib
matplotlib.axes.Axes.pcolormesh
matplotlib.pyplot.pcolormesh
Keywords: matplotlib code example, codex, python plot, pyplot Gallery generated by Sphinx-Gallery