You are reading an old version of the documentation (v3.0.2). For the latest version see https://matplotlib.org/stable/api/_as_gen/matplotlib.axes.Axes.streamplot.html
Version 3.0.2
matplotlib
Fork me on GitHub

Table of Contents

matplotlib.axes.Axes.streamplot

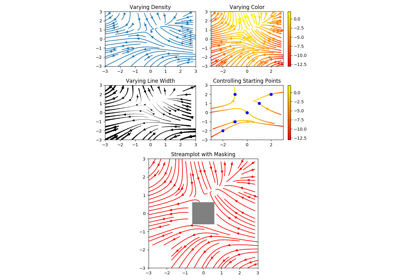
Axes.streamplot(x, y, u, v, density=1, linewidth=None, color=None, cmap=None, norm=None, arrowsize=1, arrowstyle='-|>', minlength=0.1, transform=None, zorder=None, start_points=None, maxlength=4.0, integration_direction='both', *, data=None)[source]

Draw streamlines of a vector flow.

x, y : 1d arrays
an evenly spaced grid.
u, v : 2d arrays
x and y-velocities. Number of rows should match length of y, and the number of columns should match x.
density : float or 2-tuple
Controls the closeness of streamlines. When density = 1, the domain is divided into a 30x30 grid---density linearly scales this grid. Each cell in the grid can have, at most, one traversing streamline. For different densities in each direction, use [density_x, density_y].
linewidth : numeric or 2d array
vary linewidth when given a 2d array with the same shape as velocities.
color : matplotlib color code, or 2d array
Streamline color. When given an array with the same shape as velocities, color values are converted to colors using cmap.
cmap : Colormap
Colormap used to plot streamlines and arrows. Only necessary when using an array input for color.
norm : Normalize
Normalize object used to scale luminance data to 0, 1. If None, stretch (min, max) to (0, 1). Only necessary when color is an array.
arrowsize : float
Factor scale arrow size.
arrowstyle : str
Arrow style specification. See FancyArrowPatch.
minlength : float
Minimum length of streamline in axes coordinates.
start_points: Nx2 array
Coordinates of starting points for the streamlines. In data coordinates, the same as the x and y arrays.
zorder : int
any number
maxlength : float
Maximum length of streamline in axes coordinates.
integration_direction : ['forward', 'backward', 'both']
Integrate the streamline in forward, backward or both directions.

Returns:

stream_container : StreamplotSet

Container object with attributes

This container will probably change in the future to allow changes to the colormap, alpha, etc. for both lines and arrows, but these changes should be backward compatible.

Examples using matplotlib.axes.Axes.streamplot