Version 3.0.2
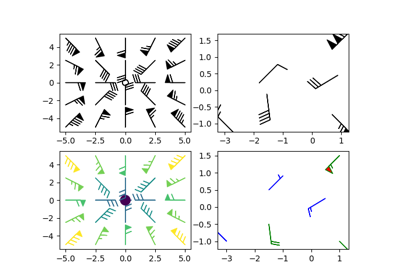
Axes.barbs(*args, data=None, **kw)[source]¶Plot a 2-D field of barbs.
Call signatures:
barb(U, V, **kw)
barb(U, V, C, **kw)
barb(X, Y, U, V, **kw)
barb(X, Y, U, V, C, **kw)
Arguments:
- X, Y:
- The x and y coordinates of the barb locations (default is head of barb; see pivot kwarg)
- U, V:
- Give the x and y components of the barb shaft
- C:
- An optional array used to map colors to the barbs
All arguments may be 1-D or 2-D arrays or sequences. If X and Y
are absent, they will be generated as a uniform grid. If U and V
are 2-D arrays but X and Y are 1-D, and if len(X) and len(Y)
match the column and row dimensions of U, then X and Y will be
expanded with numpy.meshgrid().
U, V, C may be masked arrays, but masked X, Y are not supported at present.
Keyword arguments:
- length:
- Length of the barb in points; the other parts of the barb are scaled against this. Default is 7.
- pivot: [ 'tip' | 'middle' | float ]
- The part of the arrow that is at the grid point; the arrow rotates about this point, hence the name pivot. Default is 'tip'. Can also be a number, which shifts the start of the barb that many points from the origin.
- barbcolor: [ color | color sequence ]
- Specifies the color all parts of the barb except any flags. This parameter is analogous to the edgecolor parameter for polygons, which can be used instead. However this parameter will override facecolor.
- flagcolor: [ color | color sequence ]
- Specifies the color of any flags on the barb. This parameter is analogous to the facecolor parameter for polygons, which can be used instead. However this parameter will override facecolor. If this is not set (and C has not either) then flagcolor will be set to match barbcolor so that the barb has a uniform color. If C has been set, flagcolor has no effect.
- sizes:
A dictionary of coefficients specifying the ratio of a given feature to the length of the barb. Only those values one wishes to override need to be included. These features include:
- 'spacing' - space between features (flags, full/half barbs)
- 'height' - height (distance from shaft to top) of a flag or full barb
- 'width' - width of a flag, twice the width of a full barb
- 'emptybarb' - radius of the circle used for low magnitudes
- fill_empty:
- A flag on whether the empty barbs (circles) that are drawn should be filled with the flag color. If they are not filled, they will be drawn such that no color is applied to the center. Default is False
- rounding:
- A flag to indicate whether the vector magnitude should be rounded when allocating barb components. If True, the magnitude is rounded to the nearest multiple of the half-barb increment. If False, the magnitude is simply truncated to the next lowest multiple. Default is True
- barb_increments:
A dictionary of increments specifying values to associate with different parts of the barb. Only those values one wishes to override need to be included.
- 'half' - half barbs (Default is 5)
- 'full' - full barbs (Default is 10)
- 'flag' - flags (default is 50)
- flip_barb:
- Either a single boolean flag or an array of booleans. Single boolean indicates whether the lines and flags should point opposite to normal for all barbs. An array (which should be the same size as the other data arrays) indicates whether to flip for each individual barb. Normal behavior is for the barbs and lines to point right (comes from wind barbs having these features point towards low pressure in the Northern Hemisphere.) Default is False
Barbs are traditionally used in meteorology as a way to plot the speed and direction of wind observations, but can technically be used to plot any two dimensional vector quantity. As opposed to arrows, which give vector magnitude by the length of the arrow, the barbs give more quantitative information about the vector magnitude by putting slanted lines or a triangle for various increments in magnitude, as show schematically below:
:     /\    \\
:    /  \    \\
:   /    \    \    \\
:  /      \    \    \\
: ------------------------------
The largest increment is given by a triangle (or "flag"). After those come full lines (barbs). The smallest increment is a half line. There is only, of course, ever at most 1 half line. If the magnitude is small and only needs a single half-line and no full lines or triangles, the half-line is offset from the end of the barb so that it can be easily distinguished from barbs with a single full line. The magnitude for the barb shown above would nominally be 65, using the standard increments of 50, 10, and 5.
linewidths and edgecolors can be used to customize the barb.
Additional PolyCollection keyword
arguments:
Property Description agg_filtera filter function, which takes a (m, n, 3) float array and a dpi value, and returns a (m, n, 3) array alphafloat or None animatedbool antialiasedbool or sequence of bools arrayndarray capstyle{'butt', 'round', 'projecting'} clima length 2 sequence of floats; may be overridden in methods that have vminandvmaxkwargs.clip_boxBboxclip_onbool clip_path[( Path,Transform) |Patch| None]cmapcolormap or registered colormap name colormatplotlib color arg or sequence of rgba tuples containscallable edgecolorcolor or sequence of colors facecolorcolor or sequence of colors figureFiguregidstr hatch{'/', '\', '|', '-', '+', 'x', 'o', 'O', '.', '*'} in_layoutbool joinstyle{'miter', 'round', 'bevel'} labelobject linestyle{'-', '--', '-.', ':', '', (offset, on-off-seq), ...} linewidthfloat or sequence of floats normNormalizeoffset_position{'screen', 'data'} offsetsfloat or sequence of floats path_effectsAbstractPathEffectpickerNone or bool or float or callable pickradiusunknown rasterizedbool or None sketch_params(scale: float, length: float, randomness: float) snapbool or None transformTransformurlstr urlsList[str] or None visiblebool zorderfloat
Note
In addition to the above described arguments, this function can take a data keyword argument. If such a data argument is given, the following arguments are replaced by data[<arg>]:
Objects passed as data must support item access (data[<arg>]) and
membership test (<arg> in data).