Version 3.0.0
Note
Click here to download the full example code
How to create grid-shaped combinations of axes.
subplots()- Perhaps the primary function used to create figures and axes. It's also similar to
matplotlib.pyplot.subplot(), but creates and places all axes on the figure at once. See alsomatplotlib.Figure.subplots.GridSpec- Specifies the geometry of the grid that a subplot will be placed. The number of rows and number of columns of the grid need to be set. Optionally, the subplot layout parameters (e.g., left, right, etc.) can be tuned.
SubplotSpec- Specifies the location of the subplot in the given GridSpec.
subplot2grid()- A helper function that is similar to
subplot(), but uses 0-based indexing and let subplot to occupy multiple cells. This function is not covered in this tutorial.
import matplotlib
import matplotlib.pyplot as plt
import matplotlib.gridspec as gridspec
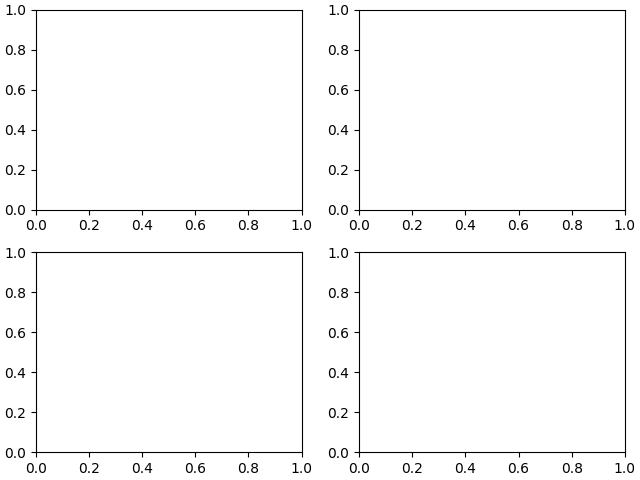
These first two examples show how to create a basic 2-by-2 grid using
both subplots() and gridspec.
Using subplots() is quite simple.
It returns a Figure instance and an array of
Axes objects.
fig1, f1_axes = plt.subplots(ncols=2, nrows=2, constrained_layout=True)

For a simple use case such as this, gridspec is
perhaps overly verbose.
You have to create the figure and GridSpec
instance separately, then pass elements of gridspec instance to the
add_subplot() method to create the axes
objects.
The elements of the gridspec are accessed in generally the same manner as
numpy arrays.
fig2 = plt.figure(constrained_layout=True)
spec2 = gridspec.GridSpec(ncols=2, nrows=2, figure=fig2)
f2_ax1 = fig2.add_subplot(spec2[0, 0])
f2_ax2 = fig2.add_subplot(spec2[0, 1])
f2_ax3 = fig2.add_subplot(spec2[1, 0])
f2_ax4 = fig2.add_subplot(spec2[1, 1])
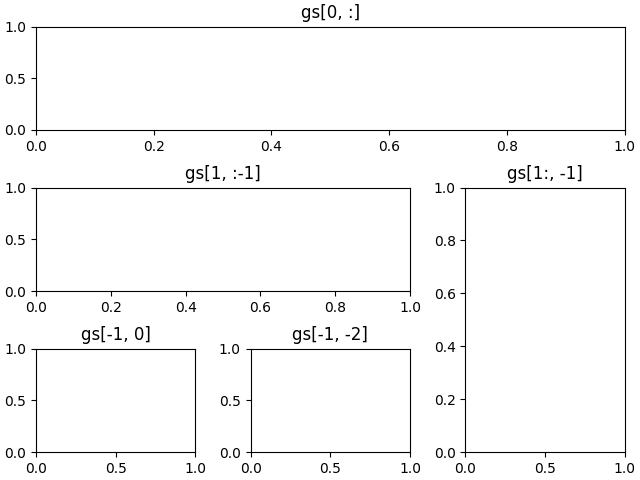
The power of gridspec comes in being able to create subplots that span rows and columns. Note the Numpy slice syntax for selecing the part of the gridspec each subplot will occupy.
Note that we have also used the convenience method Figure.add_gridspec
instead of gridspec.GridSpec, potentially saving the user an import,
and keeping the namespace cleaner.
fig3 = plt.figure(constrained_layout=True)
gs = fig3.add_gridspec(3, 3)
f3_ax1 = fig3.add_subplot(gs[0, :])
f3_ax1.set_title('gs[0, :]')
f3_ax2 = fig3.add_subplot(gs[1, :-1])
f3_ax2.set_title('gs[1, :-1]')
f3_ax3 = fig3.add_subplot(gs[1:, -1])
f3_ax3.set_title('gs[1:, -1]')
f3_ax4 = fig3.add_subplot(gs[-1, 0])
f3_ax4.set_title('gs[-1, 0]')
f3_ax5 = fig3.add_subplot(gs[-1, -2])
f3_ax5.set_title('gs[-1, -2]')
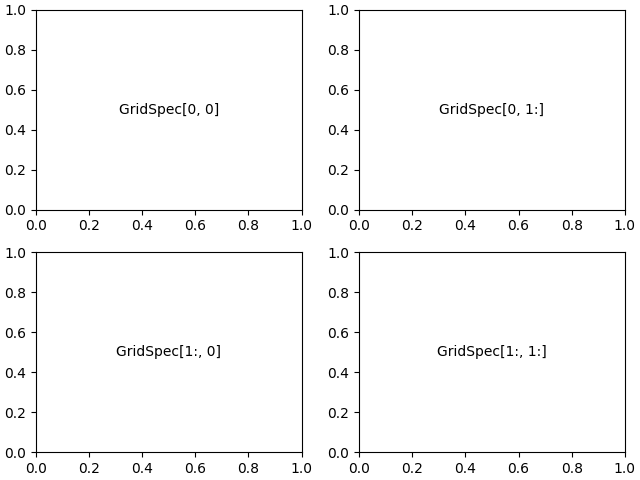
gridspec is also indispensable for creating subplots
of different widths via a couple of methods.
The method shown here is similar to the one above and initializes a uniform grid specification, and then uses numpy indexing and slices to allocate multiple "cells" for a given subplot.
fig4 = plt.figure(constrained_layout=True)
spec4 = fig4.add_gridspec(ncols=2, nrows=2)
anno_opts = dict(xy=(0.5, 0.5), xycoords='axes fraction',
                 va='center', ha='center')

f4_ax1 = fig4.add_subplot(spec4[0, 0])
f4_ax1.annotate('GridSpec[0, 0]', **anno_opts)
fig4.add_subplot(spec4[0, 1]).annotate('GridSpec[0, 1:]', **anno_opts)
fig4.add_subplot(spec4[1, 0]).annotate('GridSpec[1:, 0]', **anno_opts)
fig4.add_subplot(spec4[1, 1]).annotate('GridSpec[1:, 1:]', **anno_opts)
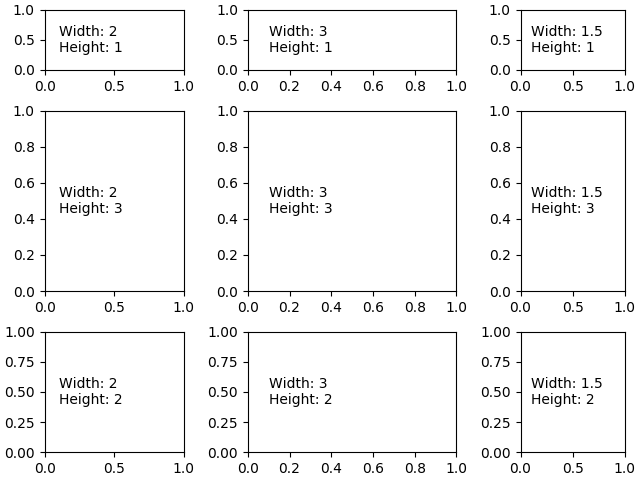
Another option is to use the width_ratios and height_ratios
parameters. These keyword arguments are lists of numbers.
Note that absolute values are meaningless, only their relative ratios
matter. That means that width_ratios=[2, 4, 8] is equivalent to
width_ratios=[1, 2, 4] within equally wide figures.
For the sake of demonstration, we'll blindly create the axes within
for loops since we won't need them later.
fig5 = plt.figure(constrained_layout=True)
widths = [2, 3, 1.5]
heights = [1, 3, 2]
spec5 = fig5.add_gridspec(ncols=3, nrows=3, width_ratios=widths,
                          height_ratios=heights)
for row in range(3):
    for col in range(3):
        ax = fig5.add_subplot(spec5[row, col])
        label = 'Width: {}\nHeight: {}'.format(widths[col], heights[row])
        ax.annotate(label, (0.1, 0.5), xycoords='axes fraction', va='center')

Learning to use width_ratios and height_ratios is particularly
useful since the top-level function subplots()
accepts them within the gridspec_kw parameter.
For that matter, any parameter accepted by
GridSpec can be passed to
subplots() via the gridspec_kw parameter.
This example recreates the previous figure without directly using a
gridspec instance.
gs_kw = dict(width_ratios=widths, height_ratios=heights)
fig6, f6_axes = plt.subplots(ncols=3, nrows=3, constrained_layout=True,
        gridspec_kw=gs_kw)
for r, row in enumerate(f6_axes):
    for c, ax in enumerate(row):
        label = 'Width: {}\nHeight: {}'.format(widths[c], heights[r])
        ax.annotate(label, (0.1, 0.5), xycoords='axes fraction', va='center')
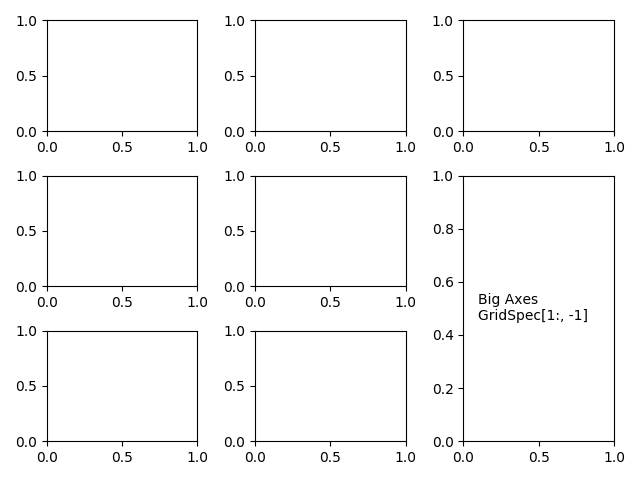
The subplots and gridspec methods can be combined since it is
sometimes more convenient to make most of the subplots using subplots
and then remove some and combine them. Here we create a layout with
the bottom two axes in the last column combined.
fig7, f7_axs = plt.subplots(ncols=3, nrows=3)
gs = f7_axs[1, 2].get_gridspec()
# remove the underlying axes
for ax in f7_axs[1:, -1]:
    ax.remove()
axbig = fig7.add_subplot(gs[1:, -1])
axbig.annotate('Big Axes \nGridSpec[1:, -1]', (0.1, 0.5),
               xycoords='axes fraction', va='center')

fig7.tight_layout()
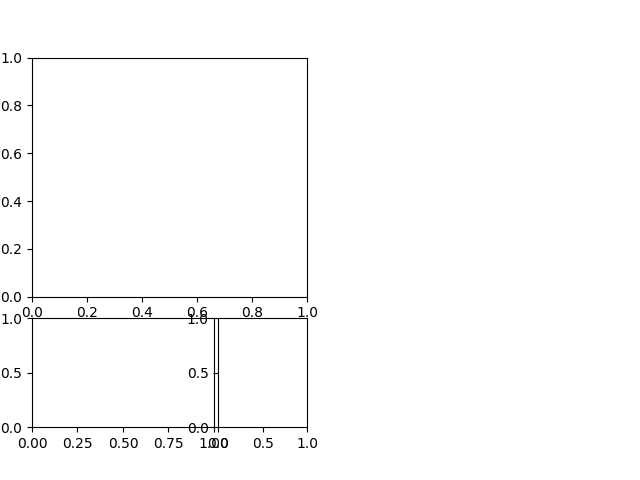
When a GridSpec is explicitly used, you can adjust the layout
parameters of subplots that are created from the GridSpec. Note this
option is not compatible with constrained_layout or
Figure.tight_layout which both adjust subplot sizes to fill the
figure.
fig8 = plt.figure(constrained_layout=False)
gs1 = fig8.add_gridspec(nrows=3, ncols=3, left=0.05, right=0.48, wspace=0.05)
f8_ax1 = fig8.add_subplot(gs1[:-1, :])
f8_ax2 = fig8.add_subplot(gs1[-1, :-1])
f8_ax3 = fig8.add_subplot(gs1[-1, -1])
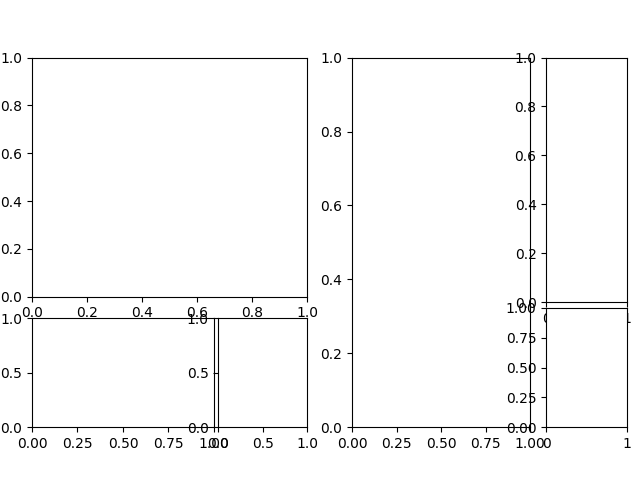
This is similar to subplots_adjust(), but it only
affects the subplots that are created from the given GridSpec.
For example, compare the left and right sides of this figure:
fig9 = plt.figure(constrained_layout=False)
gs1 = fig9.add_gridspec(nrows=3, ncols=3, left=0.05, right=0.48,
                        wspace=0.05)
f9_ax1 = fig9.add_subplot(gs1[:-1, :])
f9_ax2 = fig9.add_subplot(gs1[-1, :-1])
f9_ax3 = fig9.add_subplot(gs1[-1, -1])

gs2 = fig9.add_gridspec(nrows=3, ncols=3, left=0.55, right=0.98,
                        hspace=0.05)
f9_ax4 = fig9.add_subplot(gs2[:, :-1])
f9_ax5 = fig9.add_subplot(gs2[:-1, -1])
f9_ax6 = fig9.add_subplot(gs2[-1, -1])
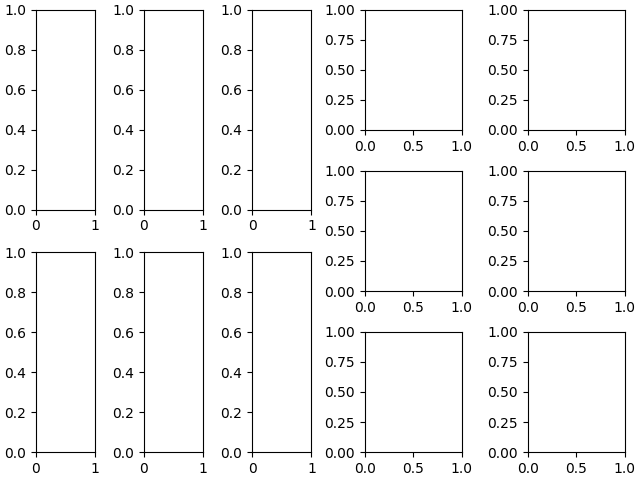
You can create GridSpec from the SubplotSpec,
in which case its layout parameters are set to that of the location of
the given SubplotSpec.
Note this is also available from the more verbose
gridspec.GridSpecFromSubplotSpec.
fig10 = plt.figure(constrained_layout=True)
gs0 = fig10.add_gridspec(1, 2)

gs00 = gs0[0].subgridspec(2, 3)
gs01 = gs0[1].subgridspec(3, 2)

for a in range(2):
    for b in range(3):
        fig10.add_subplot(gs00[a, b])
        fig10.add_subplot(gs01[b, a])
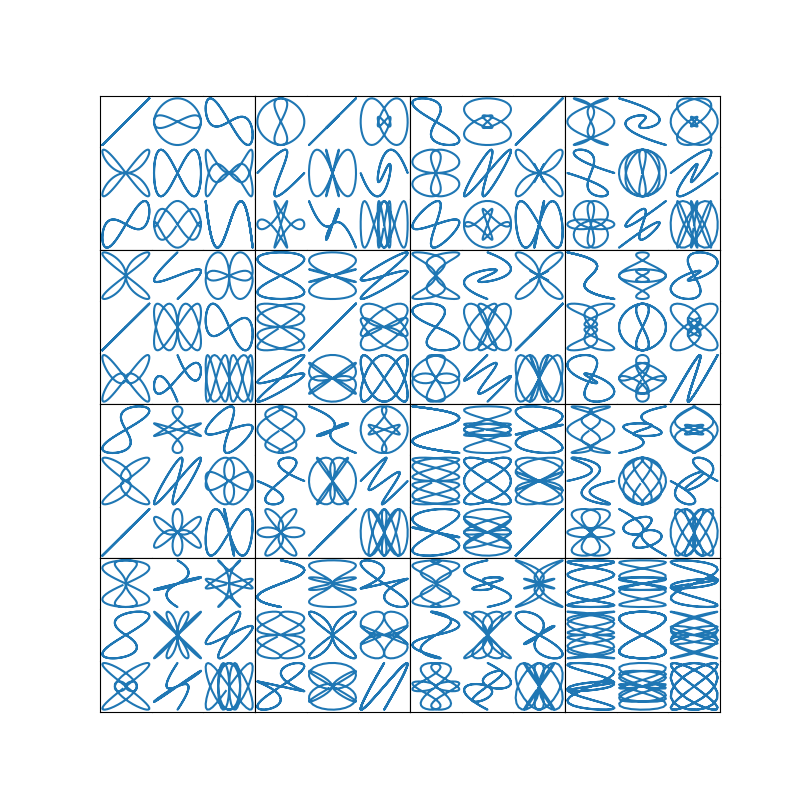
Here's a more sophisticated example of nested GridSpec where we put a box around each cell of the outer 4x4 grid, by hiding appropriate spines in each of the inner 3x3 grids.
import numpy as np
from itertools import product


def squiggle_xy(a, b, c, d, i=np.arange(0.0, 2*np.pi, 0.05)):
    return np.sin(i*a)*np.cos(i*b), np.sin(i*c)*np.cos(i*d)


fig11 = plt.figure(figsize=(8, 8), constrained_layout=False)

# gridspec inside gridspec
outer_grid = fig11.add_gridspec(4, 4, wspace=0.0, hspace=0.0)

for i in range(16):
    inner_grid = outer_grid[i].subgridspec(3, 3, wspace=0.0, hspace=0.0)
    a, b = int(i/4)+1, i % 4+1
    for j, (c, d) in enumerate(product(range(1, 4), repeat=2)):
        ax = plt.Subplot(fig11, inner_grid[j])
        ax.plot(*squiggle_xy(a, b, c, d))
        ax.set_xticks([])
        ax.set_yticks([])
        fig11.add_subplot(ax)

all_axes = fig11.get_axes()

# show only the outside spines
for ax in all_axes:
    for sp in ax.spines.values():
        sp.set_visible(False)
    if ax.is_first_row():
        ax.spines['top'].set_visible(True)
    if ax.is_last_row():
        ax.spines['bottom'].set_visible(True)
    if ax.is_first_col():
        ax.spines['left'].set_visible(True)
    if ax.is_last_col():
        ax.spines['right'].set_visible(True)

plt.show()
The usage of the following functions and methods is shown in this example:
Total running time of the script: ( 0 minutes 1.587 seconds)
Keywords: matplotlib code example, codex, python plot, pyplot Gallery generated by Sphinx-Gallery