Version 3.0.0
Note
Click here to download the full example code
Plot with radians from the basic_units mockup example package.
This example shows how the unit class can determine the tick locating, formatting and axis labeling.
This example requires basic_units.py
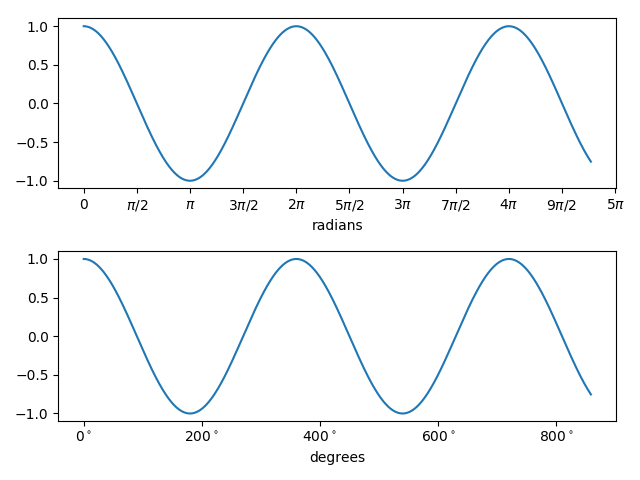
import matplotlib.pyplot as plt
import numpy as np

from basic_units import radians, degrees, cos

x = [val*radians for val in np.arange(0, 15, 0.01)]

fig, axs = plt.subplots(2)

axs[0].plot(x, cos(x), xunits=radians)
axs[1].plot(x, cos(x), xunits=degrees)

fig.tight_layout()
plt.show()
Keywords: matplotlib code example, codex, python plot, pyplot Gallery generated by Sphinx-Gallery